Contents:
Learn: Data Analyst from Scratch
Learn MoreWhen analyzing various facts of life, we often encounter a normal distribution. For example, if your grandmother's blood pressure is within the normal range for her age group, this is a positive sign. However, if your math scores are on par with the average for a general education school, and you're planning to enroll at MIPT, this may be a cause for concern. It's important to understand that the normal distribution applies not only to medicine but also to education, emphasizing the need to improve your scores to achieve high goals.
In both cases, we analyze your scores by comparing them to established norms and their boundaries. These norms are not arbitrarily generated; they are calculated based on data obtained from a wide range of observations. If you visualize these indicators on a graph, it will represent a certain pattern.
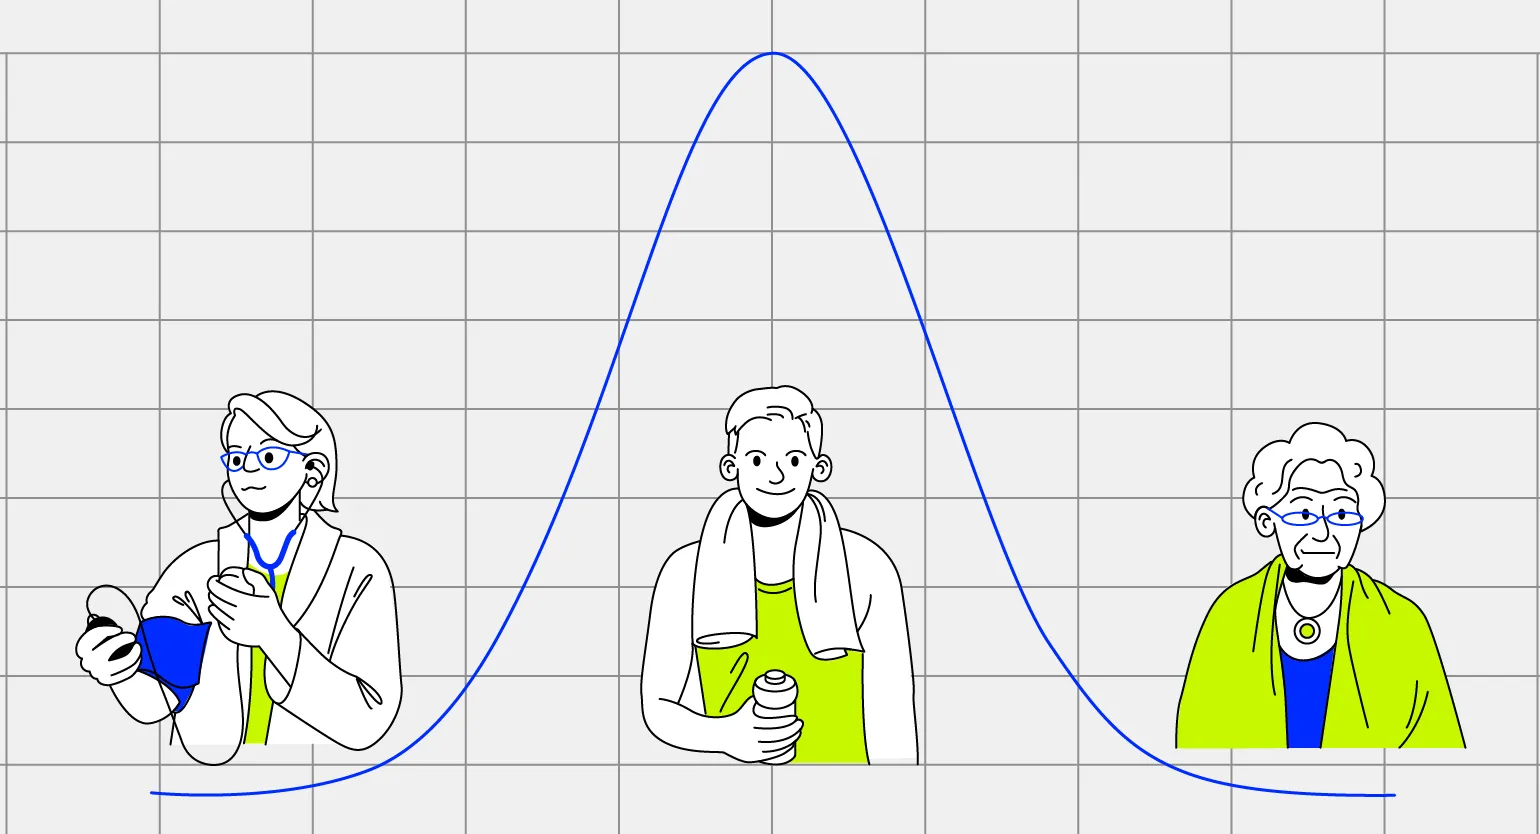
In this article, we will look at the normal distribution curve. You will learn about its basic characteristics, meaning, and applications in various fields. We will also discuss how the normal distribution curve is used in statistics and science for data analysis. You will be able to understand why the normal distribution is an important tool for researchers and analysts.
- What is a normal distribution;
- What are its properties and formulas;
- Where is it applied?
What is a normal distribution?
In statistics, distributions play a key role in analyzing the frequency of various events. A distribution can be defined as the relationship between the value of a variable and the probability with which this value can be accepted. Understanding distributions allows you to analyze data more deeply and make informed conclusions about probabilistic events. Using distributions, statisticians can assess risks, predict outcomes, and make more informed decisions based on data analysis.
When analyzing the temperature in Karaganda throughout the year, a distribution of values can be observed, reflecting the frequency of temperature ranges. For example, the probability of the temperature reaching 25°C on a given day is 10%, while the probability of reaching 30°C is 5%. This demonstrates how the city's climatic conditions can vary and which temperatures are most likely throughout the year. Analyzing such data allows for a better understanding of Karaganda's climatic features and weather forecasting.
The normal distribution is an important statistical concept characterized by the fact that most values are concentrated around the mean. It is also known as the Gaussian distribution, Gauss's law, or bell-shaped distribution. Graphically, the normal distribution is represented by a Gaussian curve, which exhibits a symmetrical shape resembling a bell. This distribution is widely used in statistics and probability calculations, as many natural and social phenomena obey this lawful behavior.
In statistics, the normal distribution is characterized by the fact that the majority of values are concentrated near the mean. Approximately 68.2% of all values are within one standard deviation of the mean. As the range increases to two standard deviations, the coverage increases to 95.4%, and at three deviations, to 99.7%. This property of the normal distribution allows for the effective analysis and interpretation of data in various fields, such as economics, sociology, and the natural sciences. Understanding these principles can help in making informed decisions based on statistical data.
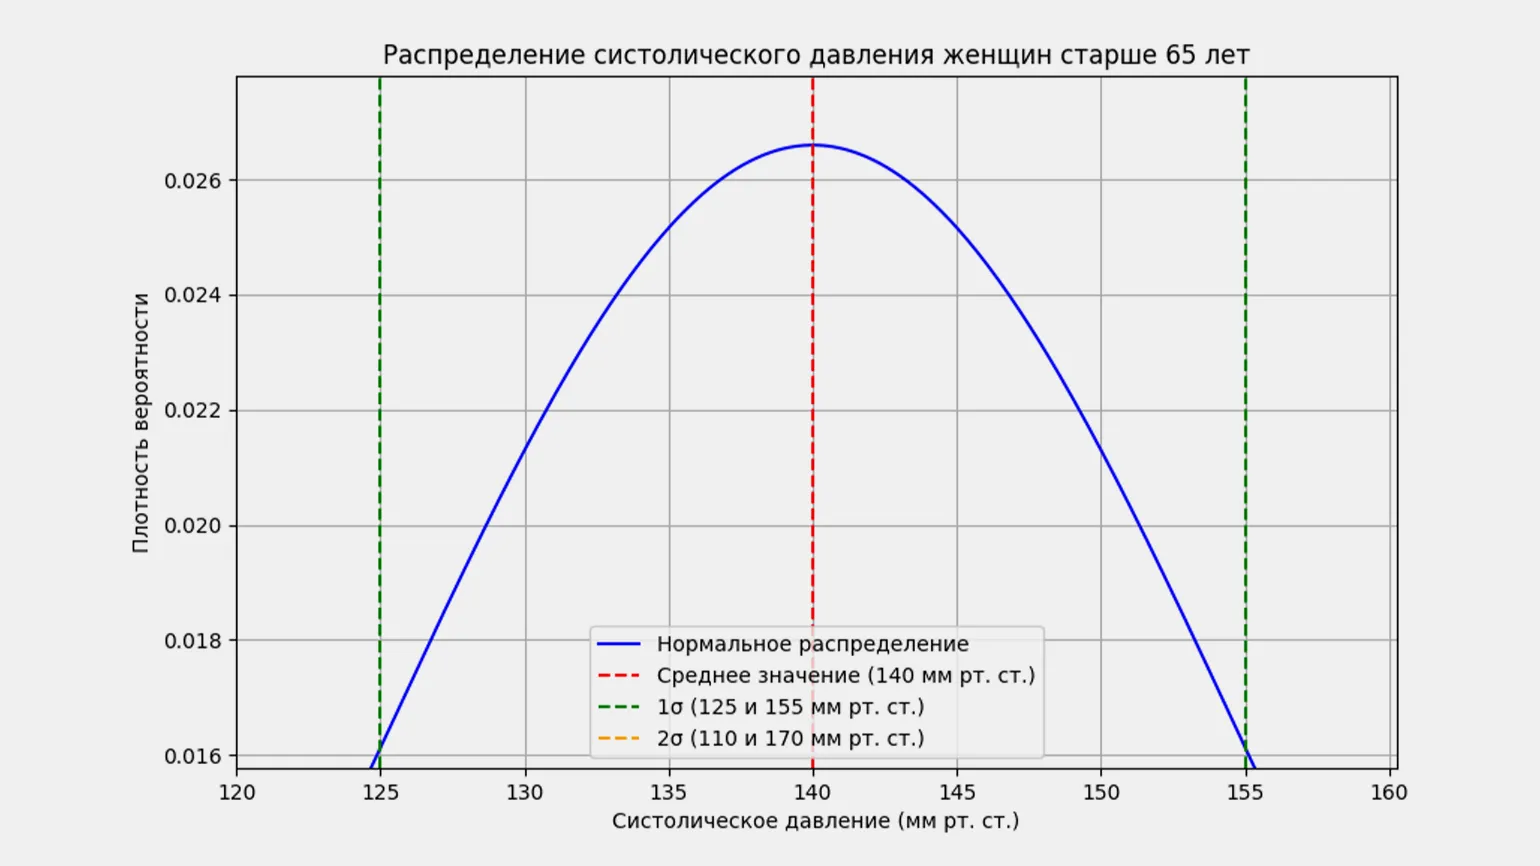
For a more illustrative example, consider a group of women over 65 and their blood pressure readings. By collecting blood pressure data from a significant number of women in this age category, one can notice that the majority of values fall within a certain range, while only a small number of values deviate significantly from this range. This observation highlights the importance of blood pressure monitoring in older women, as normal values can vary, and abnormalities may indicate the need for medical intervention.
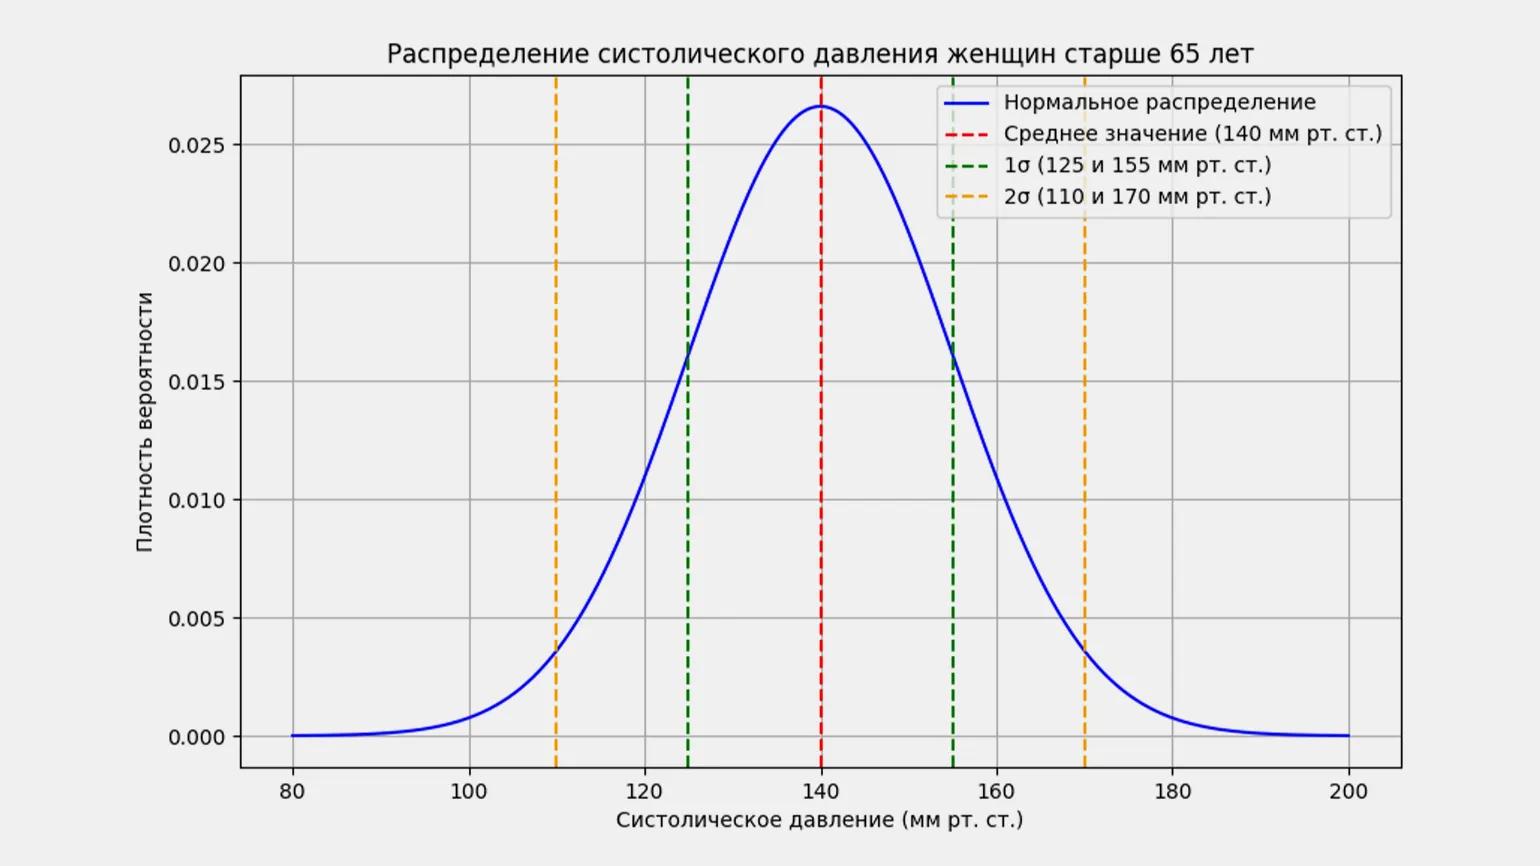
For most women, the upper pressure level varies from 125 to 155 mmHg, which corresponds to a deviation of 15 units from the average value of 140 mmHg. This variation is known as the mean, standard deviation, or root mean square deviation. In statistics, it is denoted by the Greek letter σ (sigma), and the mean by μ (mu). Understanding these metrics helps assess cardiovascular health and identify potential diseases. Proper blood pressure control is an important aspect of maintaining overall health.
The Law of Normal Distribution
Now there will come a time when fear can take hold of you.
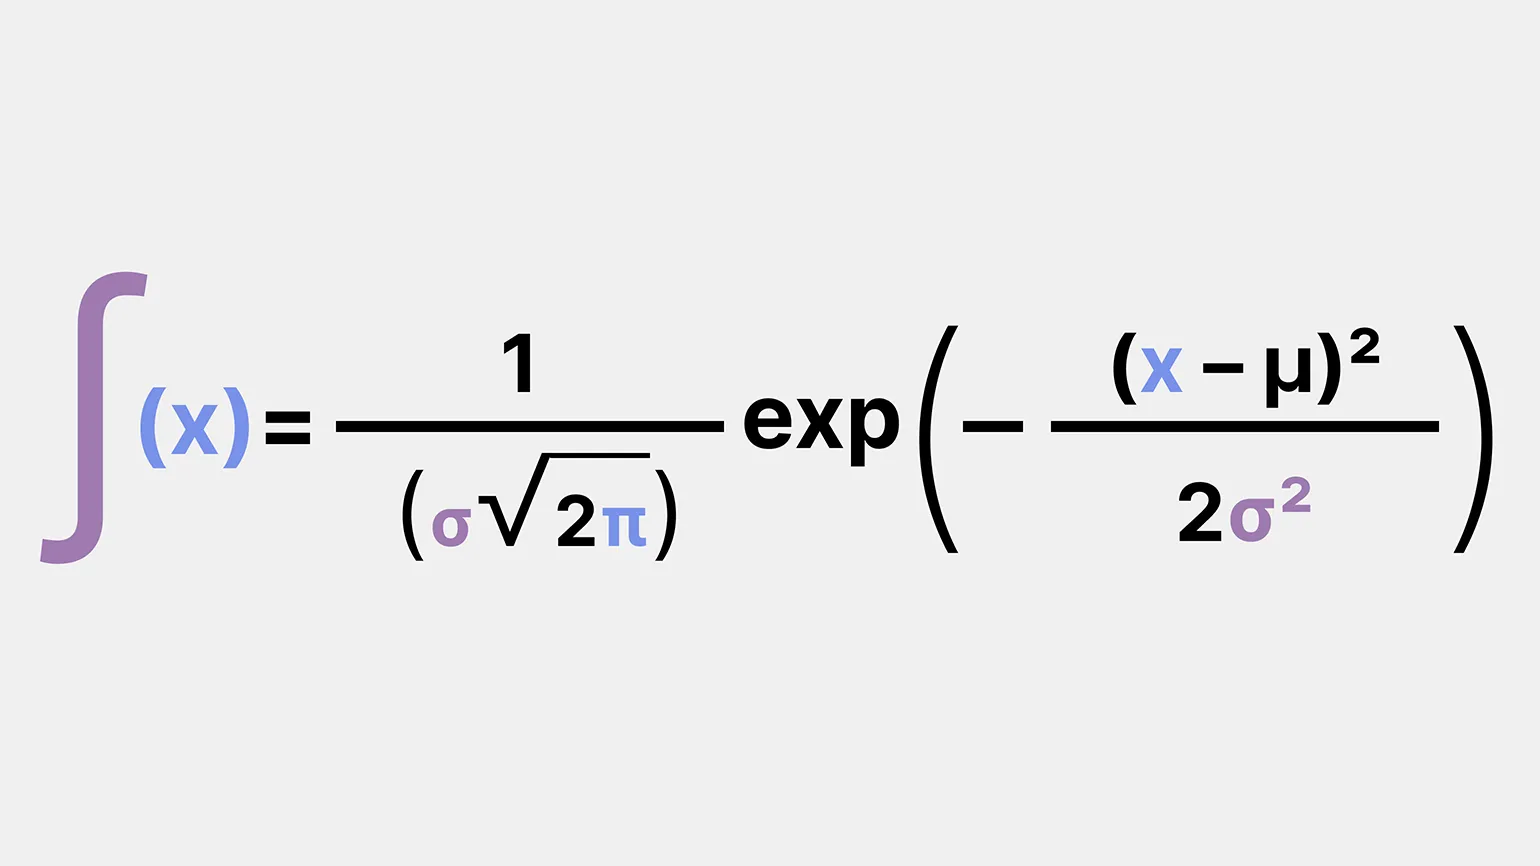
The formula for the law of normal distribution may seem complicated at first glance, but it is actually quite straightforward. Let's start with the fact that we have important parameters to consider: the mean and the standard deviation. These two parameters help describe the shape and characteristics of the normal distribution, which is widely used in statistics and various fields of science. Understanding this formula is key to analyzing data and interpreting research results, making it an essential tool for analysts and researchers.
- x is our value;
- μ is the mean. It is easy to calculate: divide the sum of values by the number;
- σ is the standard deviation. Its calculation is a little more complicated: you need to find the square root of the mean, the sum of the squares of the differences between each value and the mean.
Squaring the standard deviation yields the variance. The variance is a key indicator that demonstrates how much observations deviate from the mean within a particular distribution. This statistical parameter helps to understand the degree of variability in the data and plays an important role in the analysis and interpretation of the results.
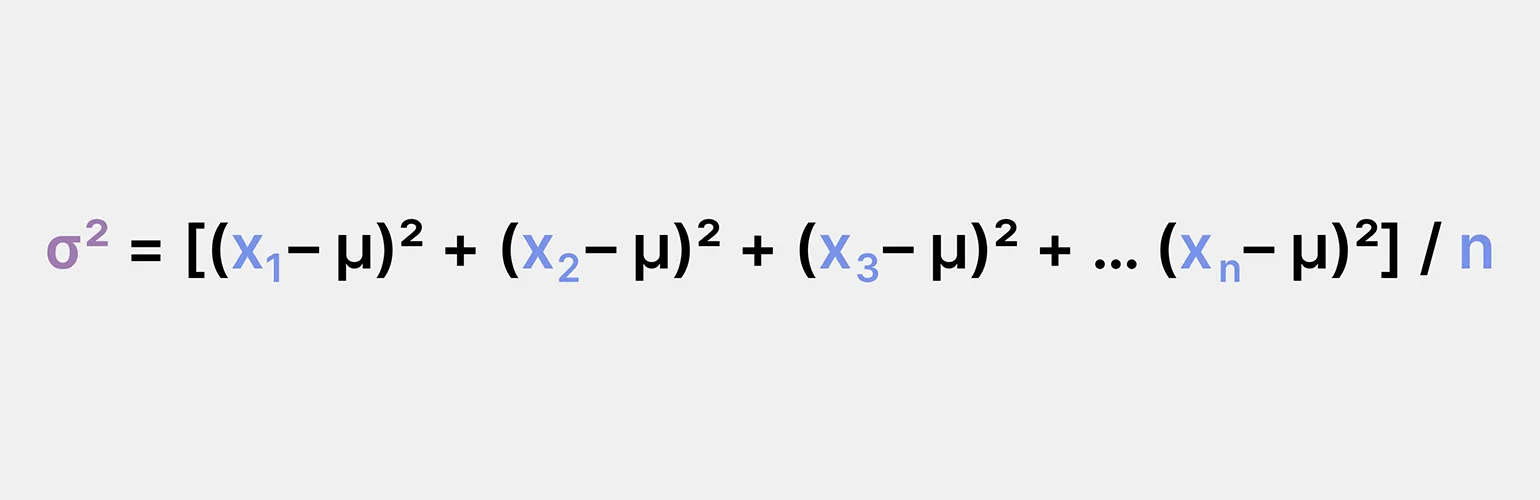
- σ2 — dispersion;
- x1, x2, x3, … xn — each English: a single value;
- μ — the mean value;
- n — the total number of values.
The mean deviation is calculated as the square root of the variance. It is an important statistical measure that allows you to evaluate the spread of data around its mean. The mean deviation helps you understand how much the values in a data set deviate from the mean. The smaller the mean deviation, the more homogeneous the data. Conversely, a high mean deviation indicates significant fluctuations. Proper understanding and use of the mean deviation plays a key role in statistical analysis and data interpretation.
- π — the mathematical constant pi (≈ 3.14159), which is the ratio of the circumference of a circle to its diameter;
- exp — the function of raising the base of the natural logarithm e (≈ 2.71828) to the power, the value of which is indicated in parentheses on the right.
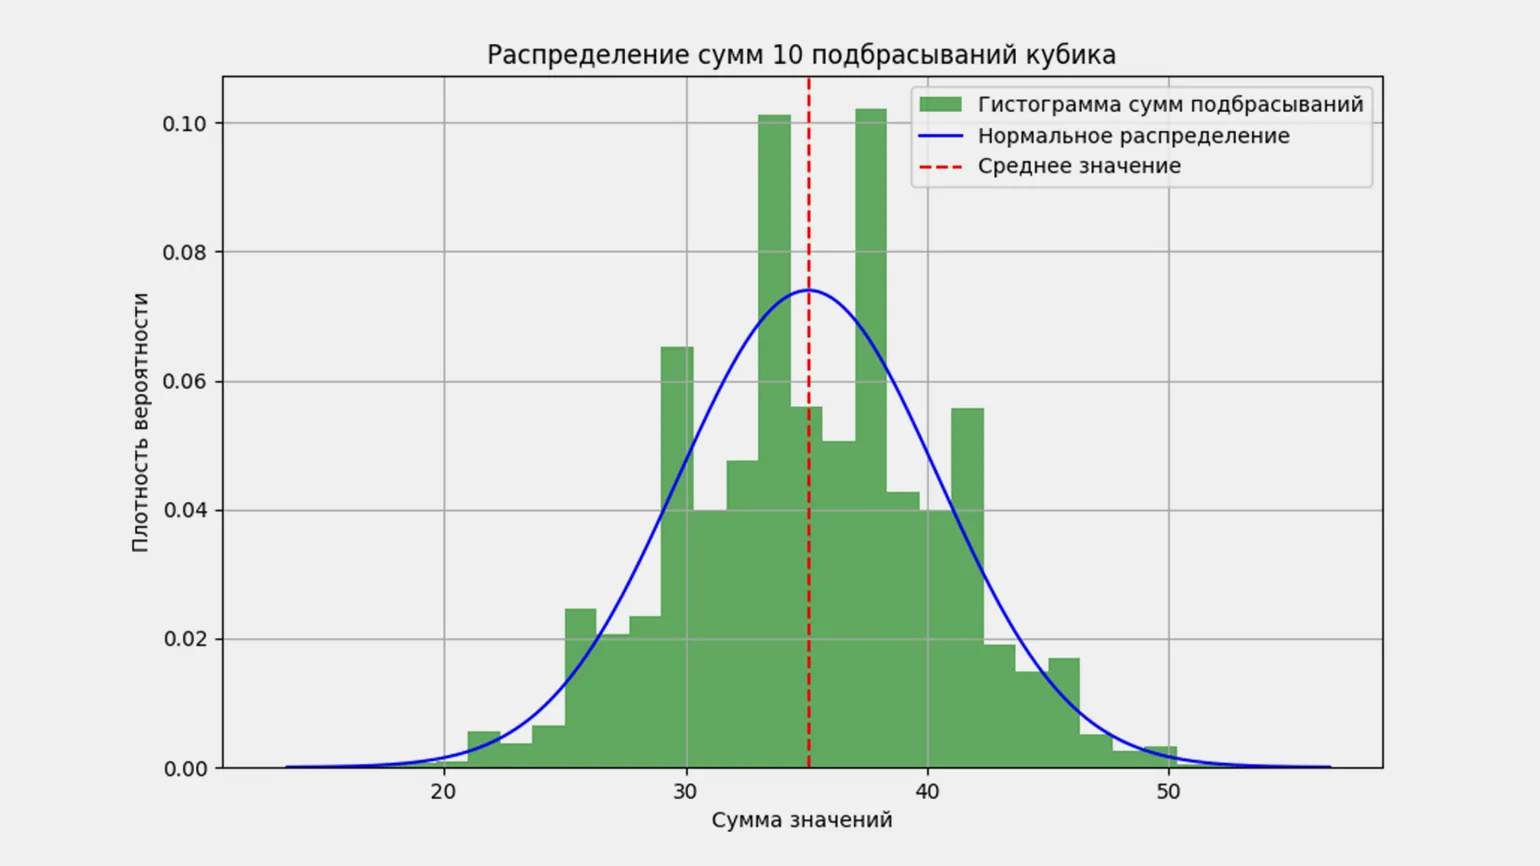
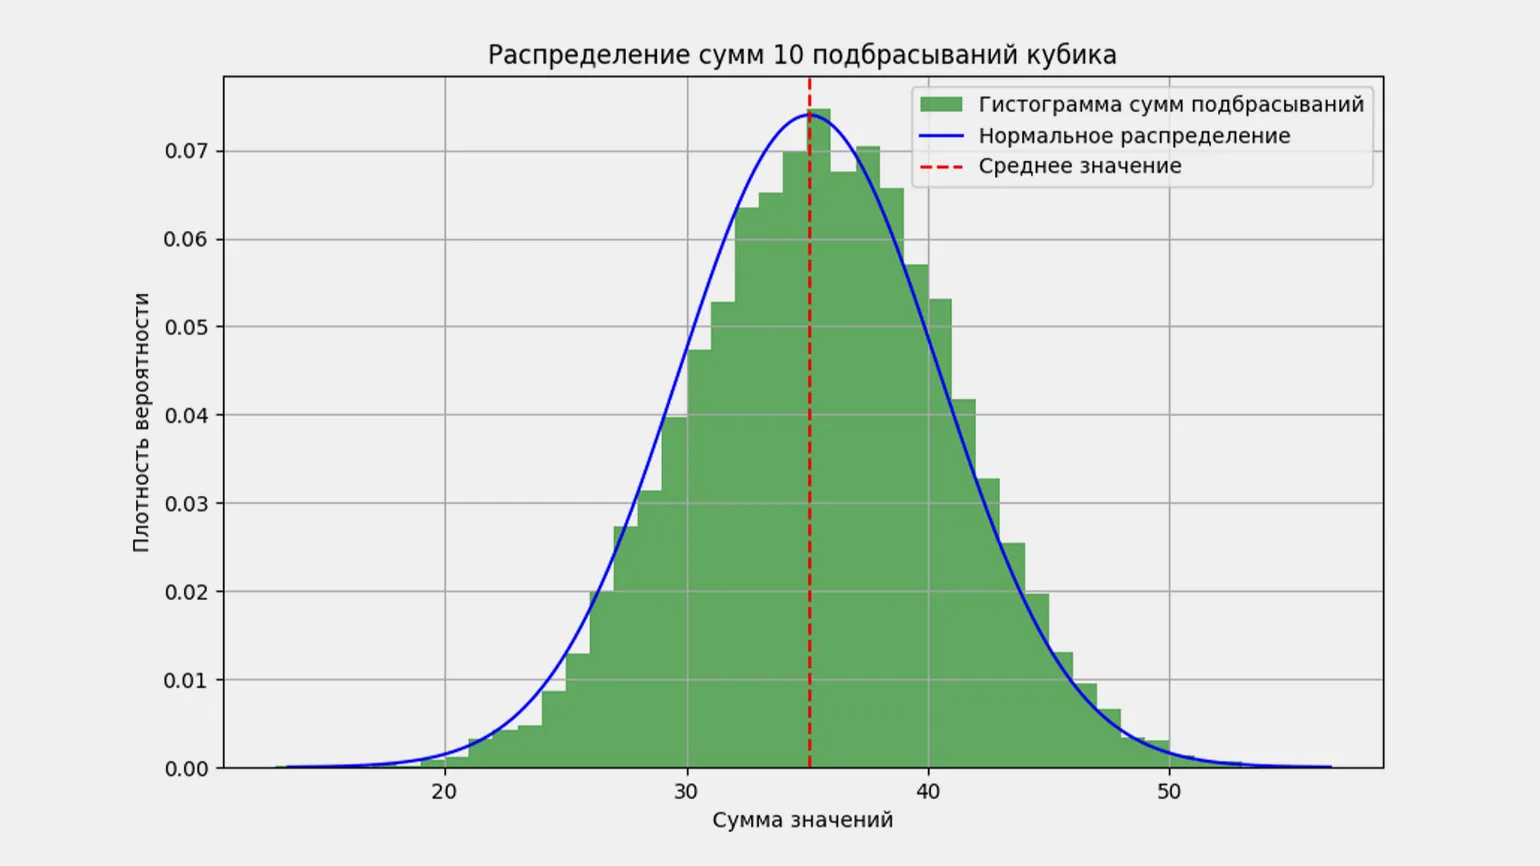
Let's check the validity of the formula using the example of throwing dice. Since we don't have access to actual dice, we'll simulate a process in which 10 dice are thrown simultaneously 10,000 times. We'll use Python and the NumPy and SciPy libraries for the simulation. The distribution plot of the toss results will be plotted using the Matplotlib library. This approach will allow us to visualize the distribution of results and analyze how well it matches theoretical expectations.
If you're familiar with Python and its libraries, you can follow along. Please note that the code uses NumPy methods, which may cause slight differences in your results. However, the distribution plot will retain its characteristic Gaussian shape. Using NumPy allows you to efficiently process data arrays and create visualizations, making it an indispensable tool for statistical data analysis.
The result of code execution is an output that depends on the logic and structure of the code itself. It's important to keep in mind that the result may vary depending on the programming language and libraries used. Typically, the result is text, numeric values, graphic elements, or changes in program state. To accurately understand the result, it's important to analyze the code, identify its main functions and operating logic. This will help you determine how exactly your code affects your data and what output it generates under different conditions.
Check the formula with our code if you don't have the opportunity to write it down on paper.
We determined the average value μ = 35 and standard deviation σ = 5.402. To check this data, we use the OwlCalculator. We enter the values in the calculator, choosing an x value in the range from 10 to 60. As an example, we will take the value 32. The calculator will provide the value of the probability density function for the specified x, which will allow us to estimate the probability of observing this value within the normal distribution.
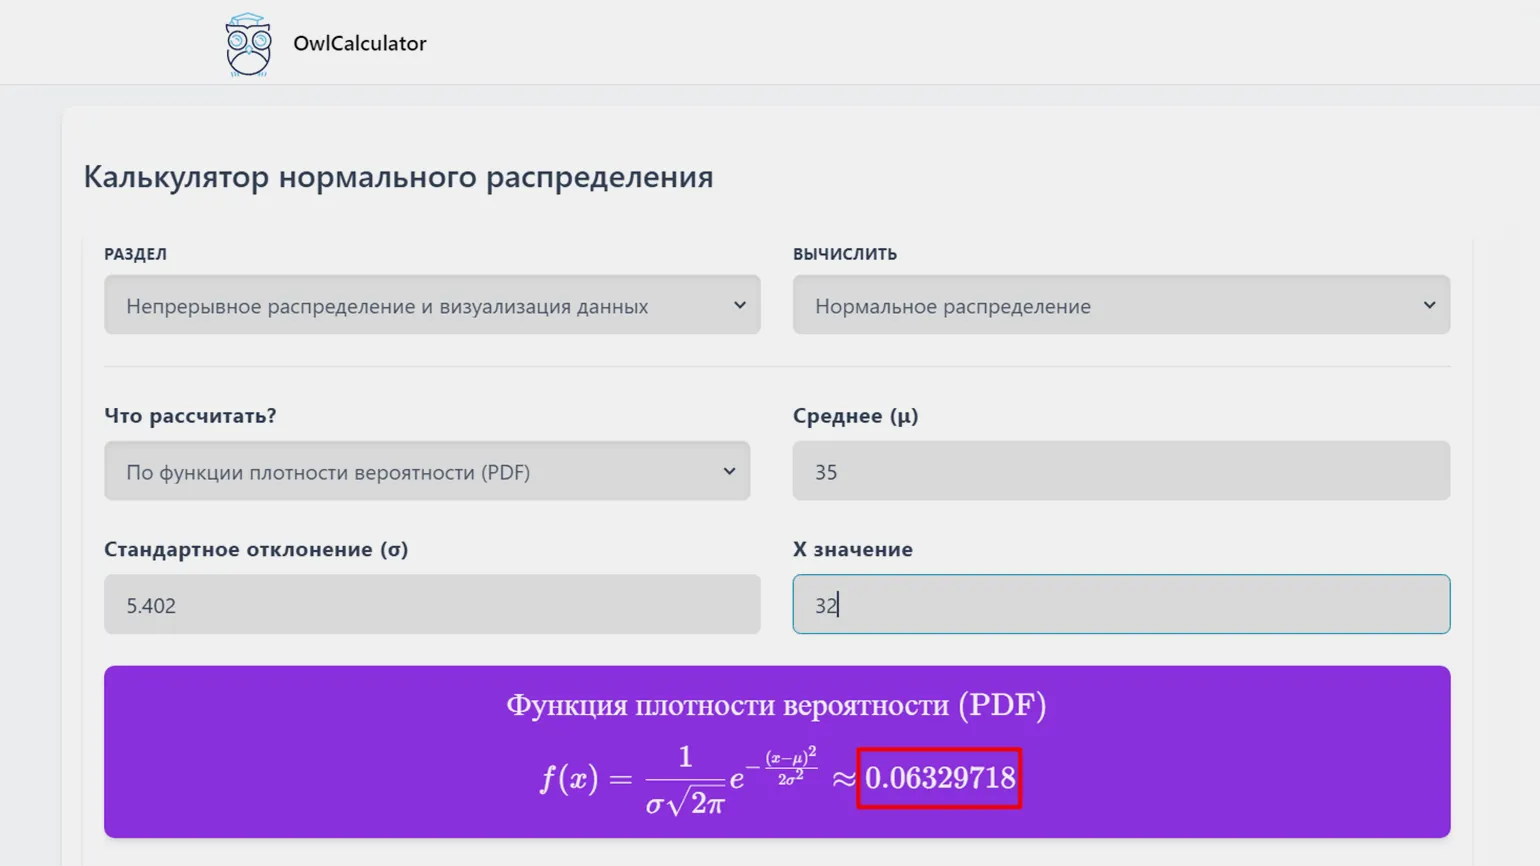
It's difficult to say for sure, but it roughly matches the graph. Let's create a histogram with a reduced scale for verification. This will allow us to analyze the data in more detail and identify possible deviations.
Here it becomes clear that the histogram value practically matches the results obtained using the calculator. This confirms the accuracy and reliability of the data presented.

Read also:
Learning Python Programming
Python is one of the most popular programming languages in the world. It is suitable for both beginners and experienced developers due to its simplicity and powerful features. You can start programming in Python by mastering basic concepts such as syntax, variables, operators, and data structures.
Python supports many programming paradigms, including object-oriented, functional, and imperative programming. This makes it a versatile tool for solving a variety of problems, from web application development to data analysis and machine learning.
Modern libraries and frameworks like Django and Flask allow you to create powerful web applications, while libraries like NumPy and Pandas make it easier to work with data.
To start programming in Python, you will need to install the Python interpreter and choose a suitable text editor or integrated development environment (IDE). It is recommended to learn the language through practice, creating small projects and solving problems.
There are many resources for learning Python, including online courses, books, and forums. The Python community is active and ready to help beginners, so feel free to ask for help and share your questions.
Learning Python programming opens many opportunities for career advancement and professional development. Start your programming journey today and discover the world of technology and innovation.
Examples of Normal Distribution
The Gaussian distribution is versatile and finds application in a wide range of fields, including marketing. For example, if you run an online store, analyzing the distribution of customer purchase amounts allows you to better understand their behavior. This data can serve as the basis for optimizing your marketing strategy and more effectively distributing targeted advertising. Understanding how customers spend money helps you identify audience segments, which leads to improved customer engagement and increased sales.
You are analyzing data on the purchase amounts of all customers over the past month. Suppose you have information on 1,000 transactions. Now you need to calculate the mean and standard deviation of these amounts. The hypothesis is that the purchase amounts are normally distributed, based on the obtained values of μ (mathematical expectation) and σ (standard deviation). This analysis will help identify general trends in consumer behavior and can be useful for planning marketing strategies.
Our calculations revealed that the average check is 5,000 rubles, while the standard deviation is 1,000 rubles. This data can be useful for analyzing customer behavior and assessing financial performance. The average check reflects typical customer spending, and the standard deviation allows us to understand how purchase amounts vary from this average. This analysis helps in making informed management decisions and strategic planning.
In this analysis, we set control limits at ±2σ from the mean, which allows us to cover approximately 95% of all observed values within a normal distribution. In our case, the control limits range from 3,000 to 7,000 rubles. This approach provides a reliable estimate of the range of values and helps in identifying deviations from the norm, which is important for further data analysis and informed decision-making in the financial sector.
Based on the calculations, we provide the following recommendations to the marketing department:
- If a client spends more than 7,000 rubles, they can be considered high-value and should be targeted with more marketing efforts.
- If a client spends less than 3,000 rubles, this indicates the possibility of improving marketing strategies to increase the average order value.
The marketing department now optimizes advertising campaigns, directing the bulk of the budget to attracting high-value clients. This will allow advertising funds to be spent efficiently and minimize waste, which in turn will increase the overall return on investment. Focusing on high-quality leads will ensure a significant improvement in results and strengthen the company's position in the market.
Marketing is not the only area where the Gaussian distribution is used. This statistical tool finds application in various fields, including finance and biology. The Gaussian distribution helps analyze data and make informed decisions based on statistical methods. Due to its versatility, it allows us to identify patterns and trends in large volumes of information, which is especially important for successful management and forecasting in various industries.
- in physics - to describe random measurement errors;
- in biology - to describe the distribution of sizes, weights, and other characteristics of populations;
- in psychology - to describe the distribution of IQ and other psychological indicators;
- in economics - to model the distribution of income, prices, and other economic indicators;
- in demography - to analyze population growth;
- in engineering - to control product quality;
- in statistical process control - to monitor production parameters;
- in research - to process the results of experiments and surveys;
- in estimation and approximation methods - to predict values based on known data and simplify complex functions or distributions.
What Remember
- The normal distribution (Gaussian distribution, bell-shaped distribution) is a type of distribution in which most values are concentrated around the mean.
- The mean μ (mu) and standard deviation σ (sigma) determine the shape of the normal distribution curve (Gaussian).
- According to the law of normal distribution, 68.2% of values are within one σ of μ, 95.4% are within two σ, and 99.7% are within three σ.
- Knowing the mean and standard deviation of a distribution, you can set control limits and make decisions based on them.
- The normal distribution is widely used in various fields: natural sciences (physics, biology), social sciences (economics, demography), psychology, industrial processes, research and data analysis.
Learn more about coding and programming in our Telegram channel. Subscribe to stay up-to-date with the latest news and useful content!
Check out additional resources:
- How to Install a Library in Python: A Beginner's Guide
- The Random Module in Python
- Working with Pandas: Basic Concepts and Real Data
Data Analyst from Scratch
Learn to analyze data using analytics services and BI tools, and master Python and SQL. You'll become an indispensable specialist—and be able to help businesses make data-driven decisions.
Find out more