Course with employment: "The profession of a Methodologist from scratch to PRO"
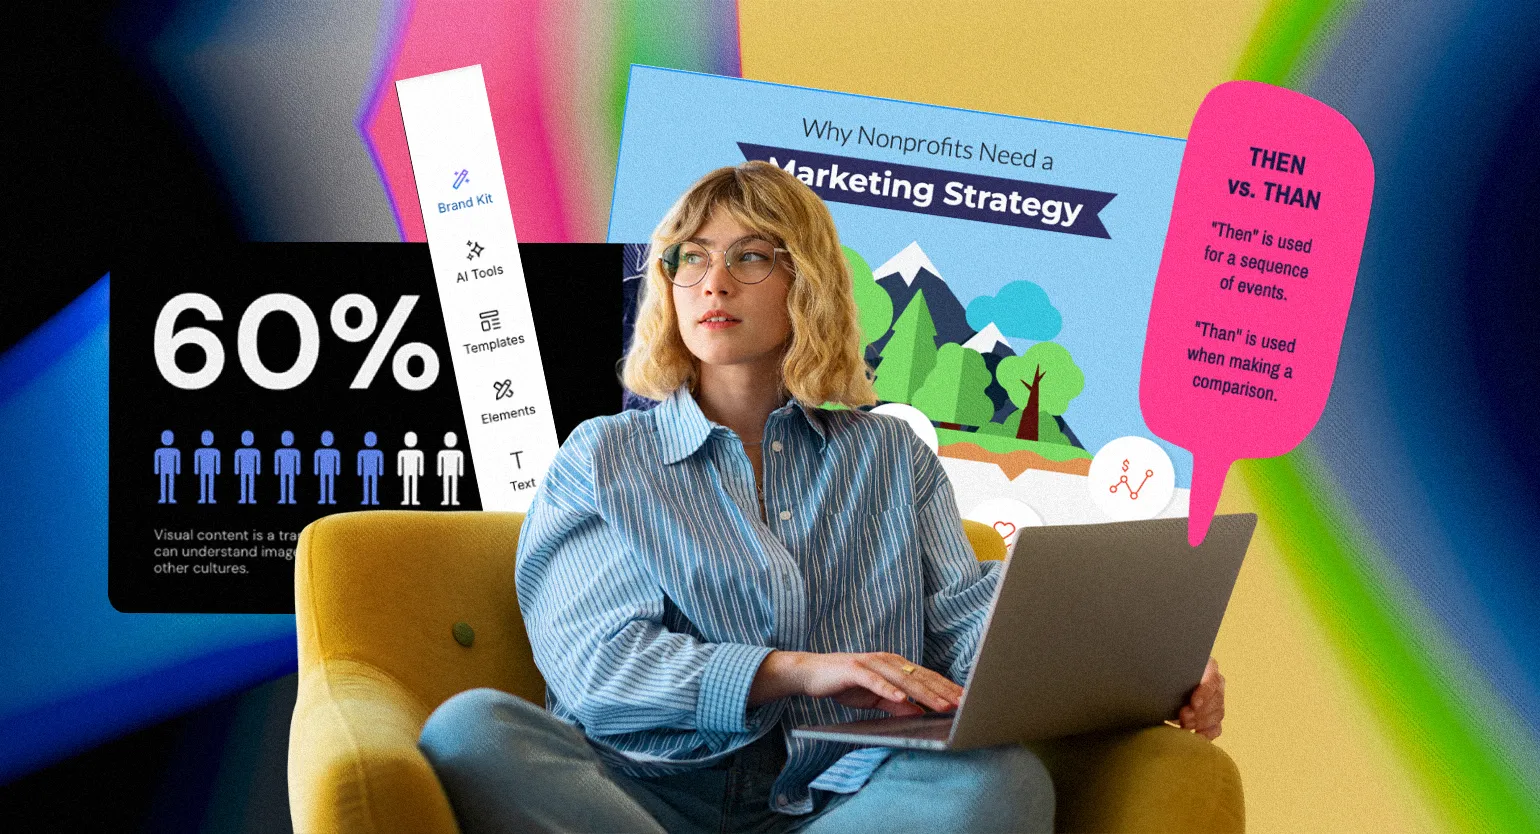
Find out moreInfographics is an effective method of visualizing information that allows you to convey text and numerical data through charts, graphs, diagrams, and mind maps. Infographics facilitate a clearer understanding of complex concepts and facts, making it easier for audiences to comprehend the information. Their clarity and structure make infographics a powerful tool for communicating key ideas and data, making them indispensable for educational, marketing, and research purposes. Infographics play a key role in educational presentations and online courses, and are also widely used as classroom handouts. This is because, according to dual coding theory, information visualization helps organize verbal data. The simultaneous use of visual and verbal elements improves memorization and learning. The principle of modality, based on multimedia learning theory, supports this idea. Even if you are not familiar with these theories, you have probably noticed that a well-designed visual diagram conveys information much more effectively than pages of text. Infographics not only simplify the perception of complex data but also make the learning process more engaging and productive.
Modern digital services offer the ability to create attractive and informative infographics without the need for design skills. These tools often include collections of templates suitable for various topics and tasks, allowing users to easily edit and populate them with their own data. Many infographic makers also integrate artificial intelligence technologies, offering a variety of features—from generating individual images to creating practically ready-made materials. These capabilities make the infographic creation process more accessible and convenient for a wide audience.
This selection presents infographic makers available to Russian users. We have selected tools that are free to use, albeit with certain limitations. All of them support Cyrillic, but not all have a Russian interface. If you have difficulty understanding, automatic translation in your browser may be helpful. These infographic makers will help you create high-quality, visually appealing infographics for a variety of purposes, including training, presentations, and content promotion. There are many tools designed for creating infographics for marketing and business purposes, including Russian services like Fabula AI, Wilda, Supa, and Wondercard. However, this selection specifically features platforms that offer infographic templates designed for educational purposes. Using such tools allows you to effectively visualize information and improve the perception of educational material.
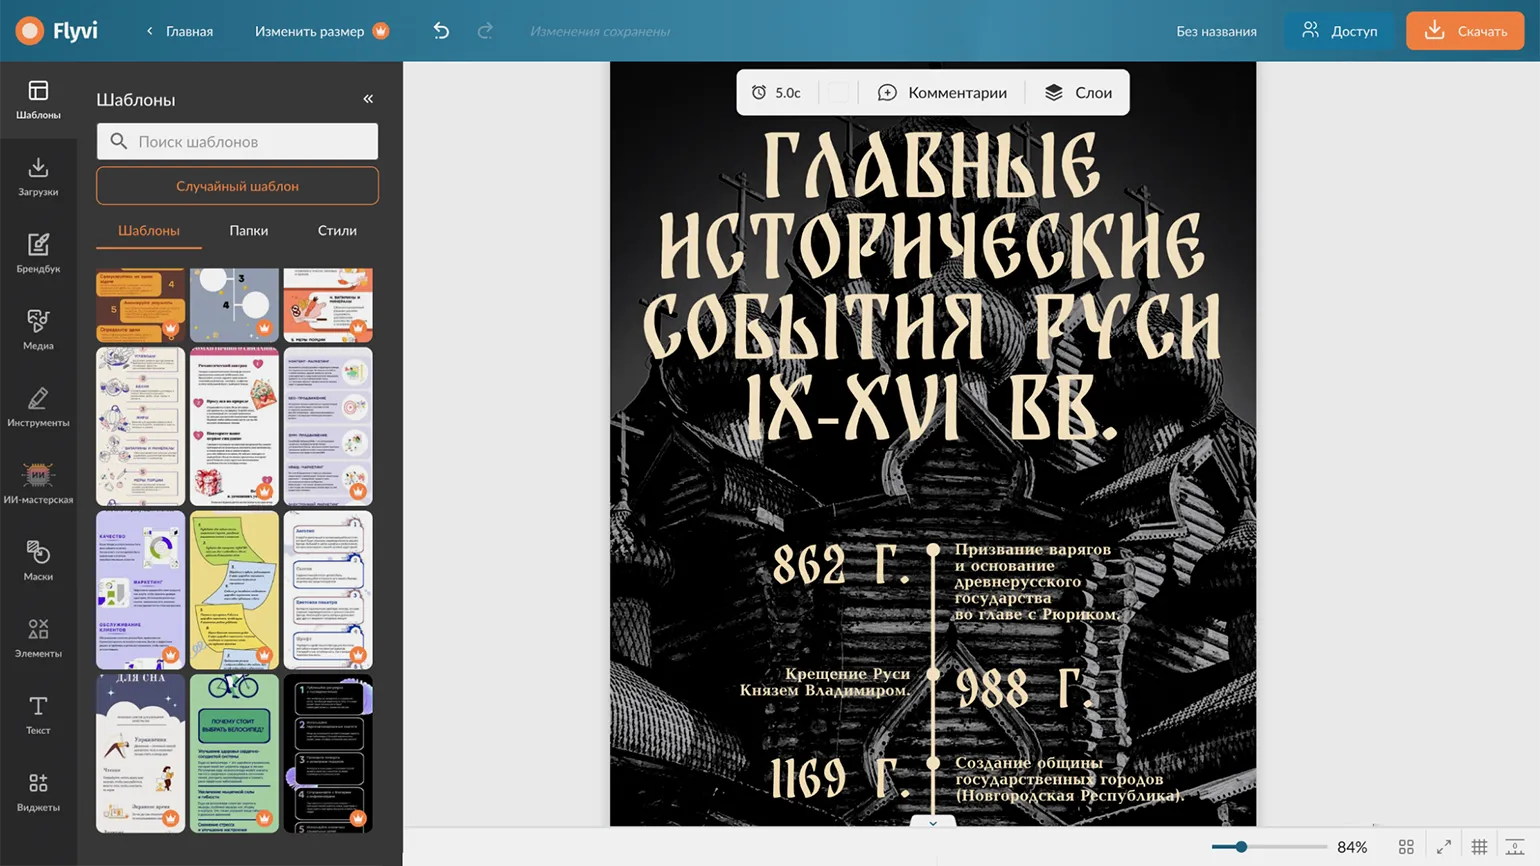
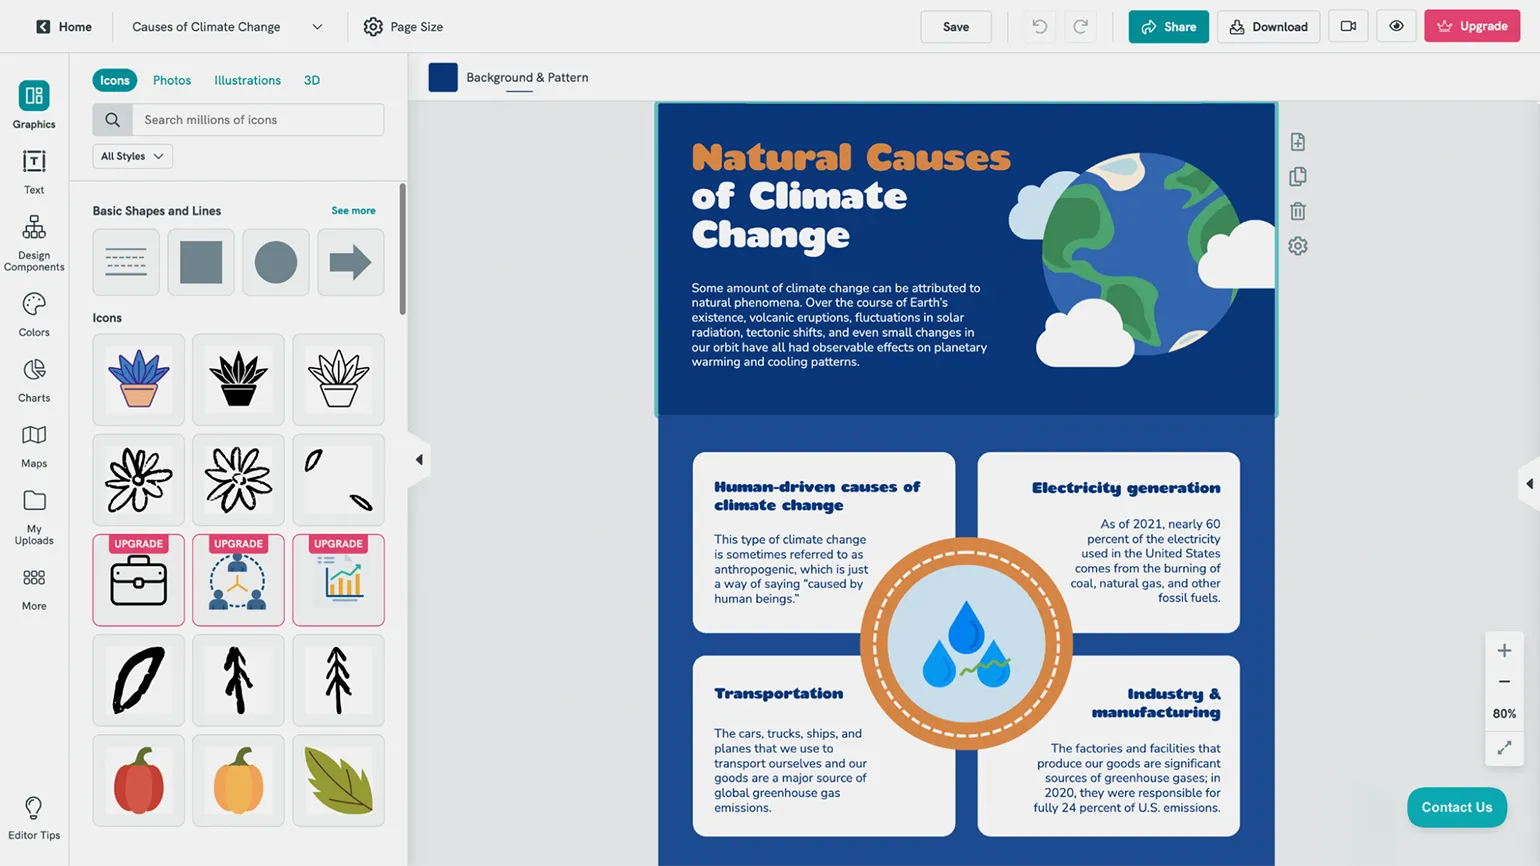
Flyvi
Registration is available via email, as well as using a Google or Yandex ID account.
Subscriptions start at 499 rubles per month, with the possibility of receiving a discount when paying annually. You can also purchase AI tokens separately, without paying the full plan.
The free plan has its limitations. Users can use basic templates, but downloaded materials are watermarked. In addition, up to 10 files can be uploaded from the user's device. This plan provides 5 tokens per month for using AI functions, while generating one image requires 1 token.
The interface is available in Russian.
This is a Russian platform offering a wide selection of visual templates designed for business, marketing, and educational purposes. In the "Print" category, you'll find a variety of templates for creating educational and awareness-raising infographics. The platform is ideal for professionals looking to improve the visual presentation of information and enhance the effectiveness of communication.
After selecting a template, you can customize its color palette and add media files you've uploaded or accessed from the Flyvi media library. You can also include charts, tables, shapes, icons, and text blocks. You can also draw on the page manually, just like on an online whiteboard. Interactive widgets are available for adding QR codes and hyperlinks to your content, significantly enhancing interaction with the content.
The platform offers an AI workshop that provides a wide range of tools for generating text and images, as well as for editing photos. These features allow you to remove and replace backgrounds or individual objects in images, enlarge photos, and improve their quality. Users can also colorize black-and-white photos and remove watermarks. These features make the platform an ideal solution for those who want to improve the quality of their visual materials and simplify the editing process.
Infogram
Registration is available via email or using a Google account. Choose a convenient method for you to quickly create an account and start using our services.
Subscriptions start at $25 per month, with the possibility of receiving a discount by paying for the entire year.
The free plan has certain limitations: you can store up to 10 materials on your account at a time, and each material can contain a maximum of 5 pages. In addition, downloading materials is not available - you can only make them publicly available via a link that is indexed by search engines.
The interface is only available in English.
The service offers an extensive library of templates for creating infographics, dashboards, reports, posters and covers for social media posts, as well as individual diagrams and maps. A primary focus on infographics highlights Infogram's uniqueness in data visualization. The platform provides users with all the necessary tools for effective and visual presentation of information, making it the ideal solution for professionals and companies seeking to improve the perception of their data.
The free plan provides users with access to several dozen chart types. These include traditional line, column, and pie charts, as well as more specialized formats such as scatter, radar, pictogram, and Sankey plots. Users can test the table data upload feature, which is currently in beta. The platform automatically suggests the most appropriate visualization method for uploaded data, significantly simplifying the process of creating graphs and charts.
The developers have invested significant effort in creating content block designs where text harmoniously combines with graphic elements. For example, the "image with caption" format offers over 50 different options. Similar template collections are available for lists, galleries, and collages, as well as for classifications, step-by-step plans, notes, and quotes. This approach improves the visual perception of information and increases the appeal of the content, which in turn facilitates better user engagement.
For the rapid creation of infographics, we recommend using artificial intelligence. Choose a suitable template, formulate a prompt for its content, and then make the necessary edits to the material. This approach allows you to effectively and quickly generate visual content that will attract attention and improve the perception of information.
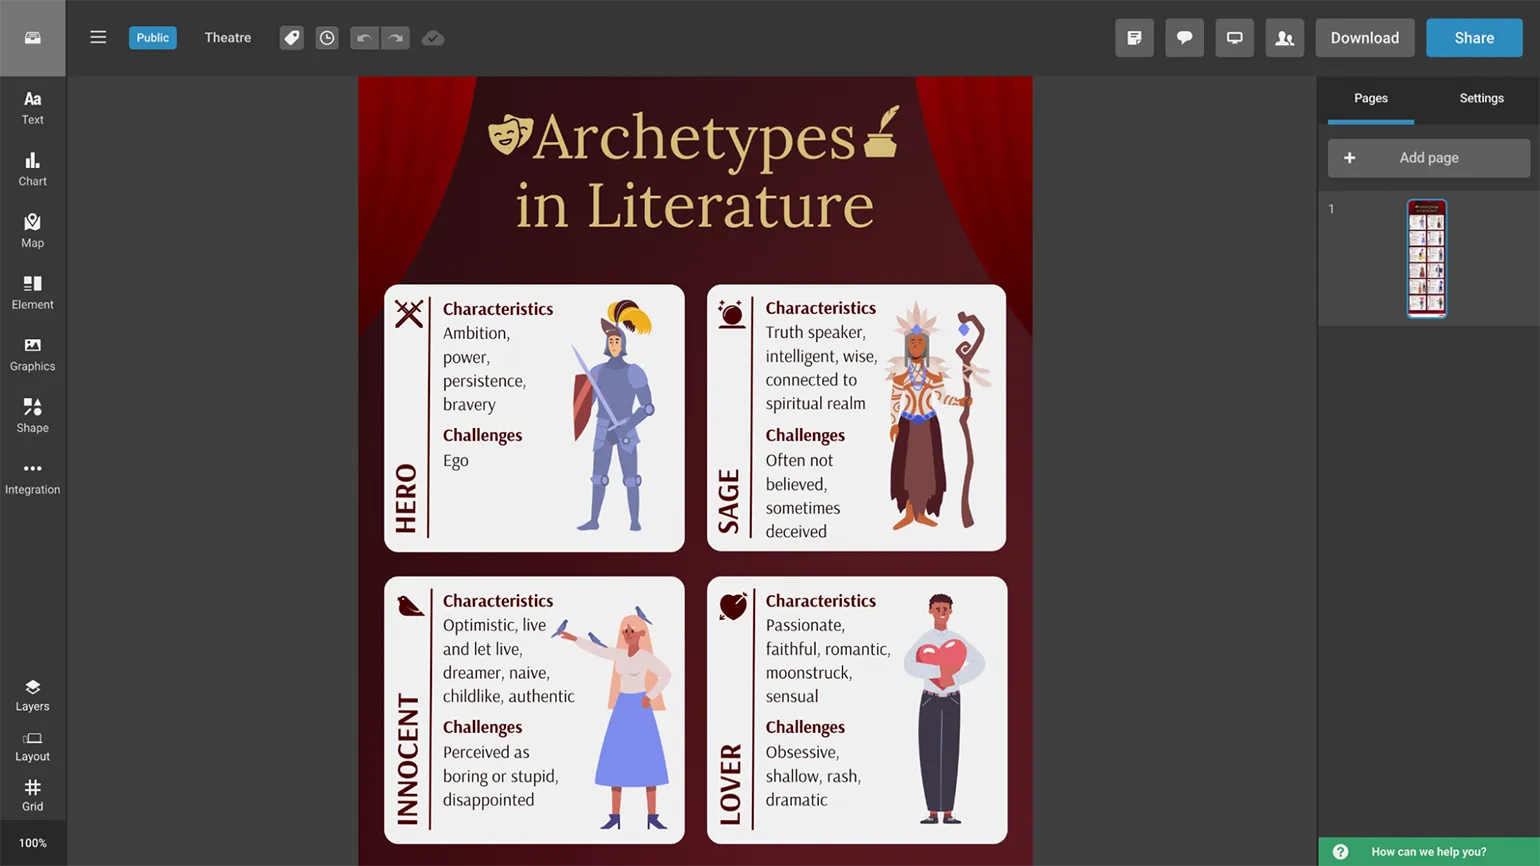
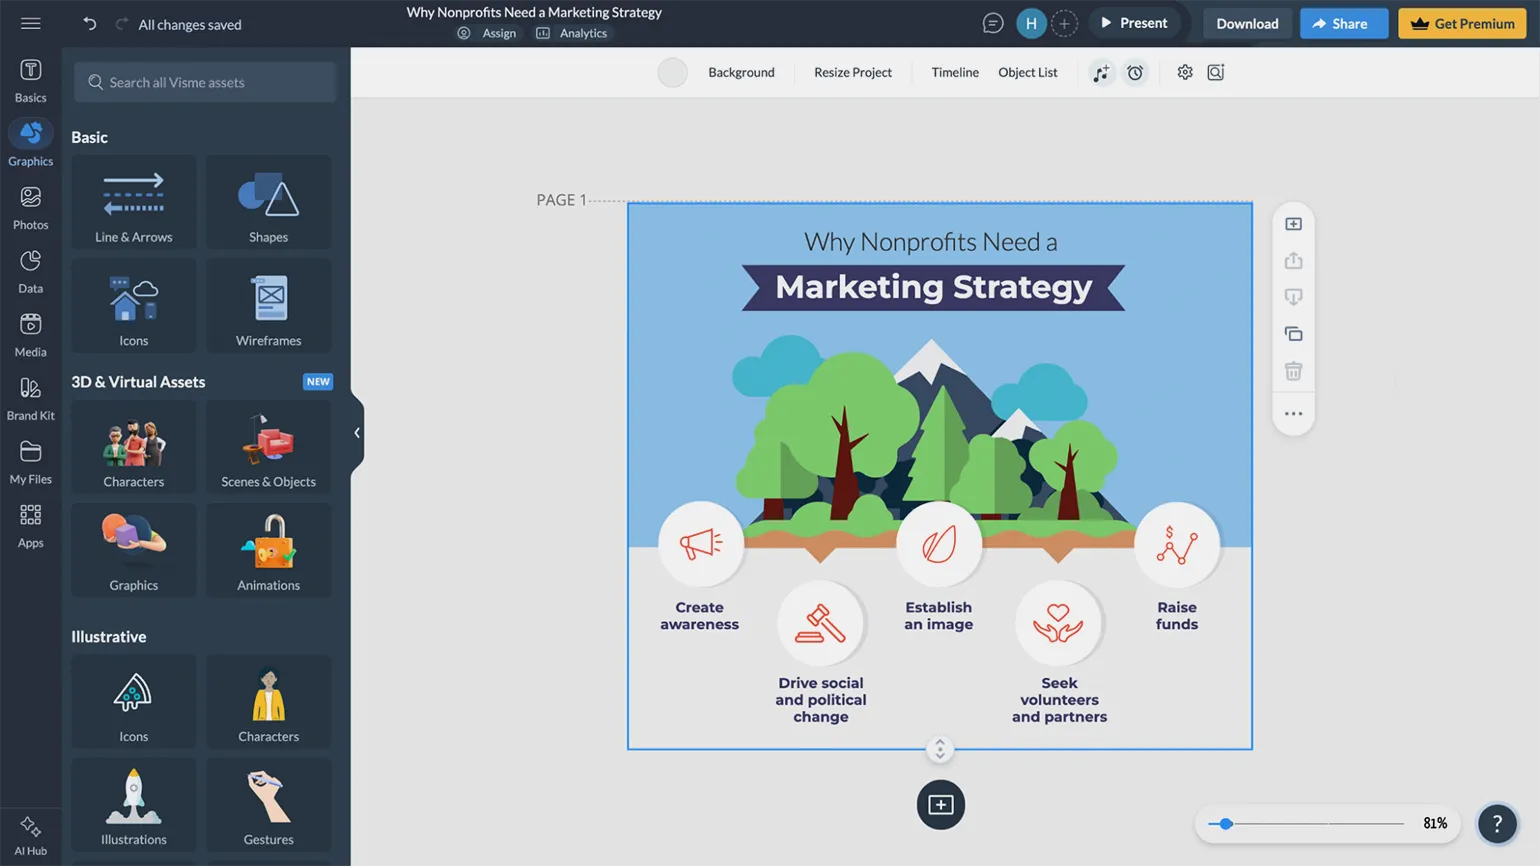
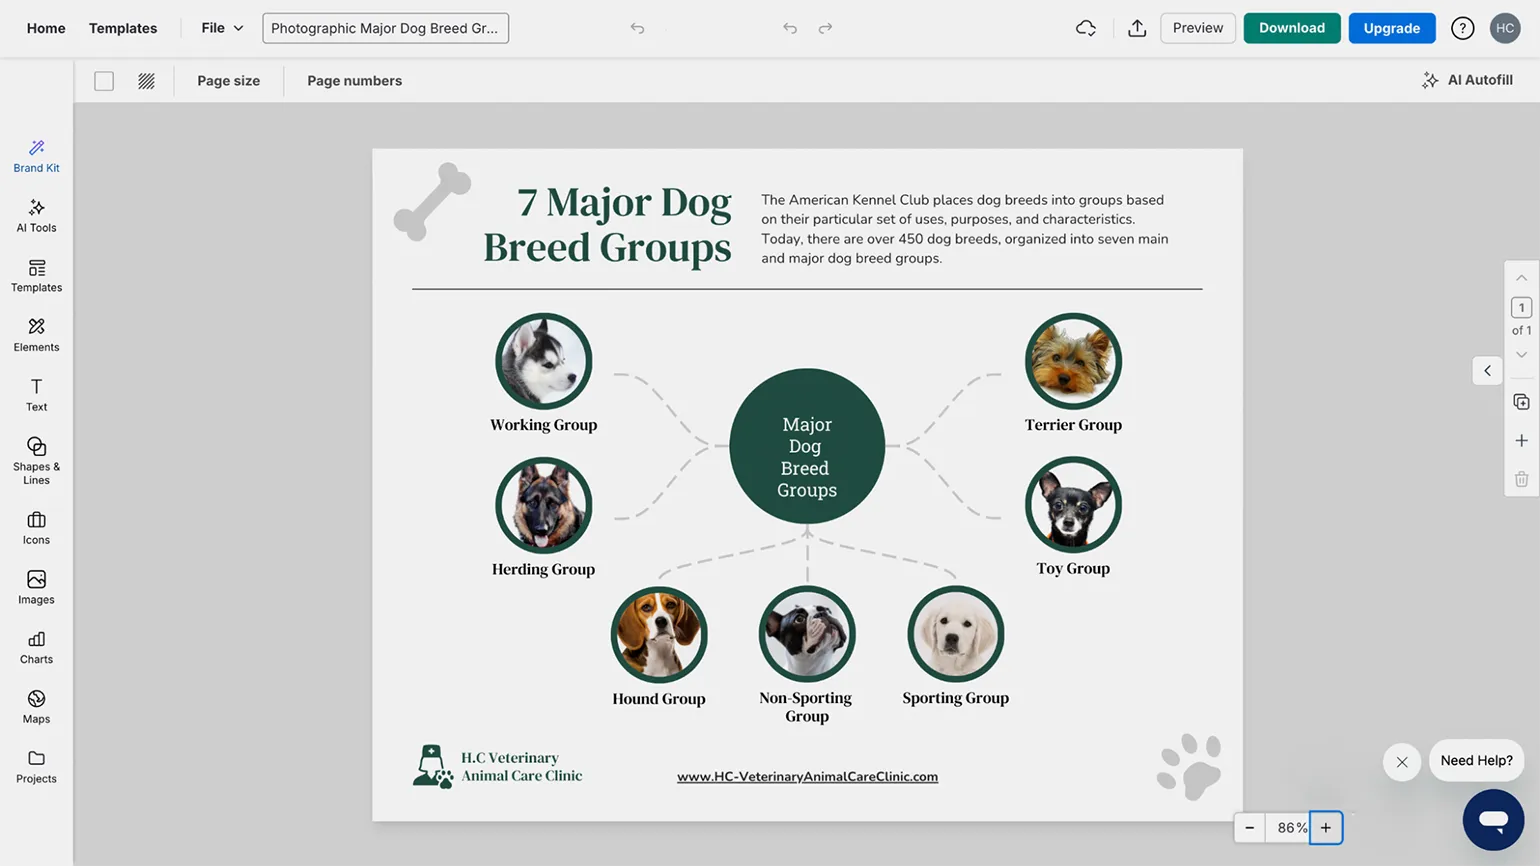
Visme
Registration is available via email or using a Google account. Choose a convenient method for you to quickly and easily create an account.
Subscriptions start at $29 per month. Paying for an entire year at a time provides a discount, allowing for significant savings.
The free plan has certain limitations: 500 MB of storage space and 10 credits per month for access to artificial intelligence features. Generating a single image costs 1 credit, and creating a visual template costs 3 credits. It is also worth noting that users cannot download materials or share them privately; content is only accessible publicly via the provided link.
The interface is available in Russian, but its localization is partial.
This platform for creating diverse visual materials offers a wide range of tools for creating presentations, business cards, and infographics. A vast collection of templates is available, organized by category, making it easy to choose based on your needs. Templates are included for visualizing statistical data, processes, and hierarchies, as well as for comparative analysis of objects. Also available are options based on geographic maps, timelines, microlearning cards, diagrams, charts, and graphs. All templates are designed in a variety of visual styles, allowing you to find suitable solutions for everything from literature lessons to industrial safety courses. Using these templates will help make your content more engaging and understandable for your audience.
Each template is easily editable, allowing you to arrange elements as desired, remove unnecessary elements, and add text, static images, GIFs, tables, as well as audio and video content. The Visme platform offers an extensive media library of ready-made objects. If you can't find the right content, you can turn to artificial intelligence to generate an image or a new template that meets your requirements right on the platform.
Venngage
Registration is available via email or using a Google account. Choose a convenient method for you to quickly and easily create an account.
Subscriptions start at $19 per month. A discount is available when paying annually.
The free plan has limitations: you can post no more than 5 materials at a time and upload a maximum of 6 media files. Also, only public links to posted materials are supported.
The interface is not available in Russian.
The platform provides a wide selection of templates for creating visual materials, including infographics, presentations, timelines, posters, postcards, collages, and schedules. Users can easily edit selected templates using the built-in designer, adapting them to their needs and tasks. This makes creating professional visual materials accessible and convenient for all users. Infographics can be enriched with various elements, such as tables, charts, shapes, and icons from Venngage's media library. Interactive components are also available, including checklists, multiple-choice quizzes, and clickable tooltips. The platform offers artificial intelligence features, but not all of them are available on the free plan. Users can generate text, images, or icons for their materials, as well as commission a unique infographic design from the AI assistant. This allows us to significantly improve the quality and attractiveness of the information presented, making it more accessible and interesting for the audience.
Piktochart
Registration is available via email or using a Google account.
The service starts at $29 per month. A discount is available when paying annually, making this offer even more advantageous.
The free plan has a number of limitations: storage is 100 MB, users can download two PNG images, after which access to the materials is only possible via a public link. 50 AI credits are also provided, with the generation of one image or design requiring the use of one credit.
The interface is partially available in Russian.
This platform offers a wide range of templates for information visualization. Infographic templates are classified by type depending on the tasks they solve. You'll find solutions for comparing objects and phenomena, presenting survey and research results, creating checklists, and displaying chronological processes and other types of data. These templates will help you effectively communicate information to your audience and improve data comprehension.
The editor allows you to choose a template color scheme and add various elements to your content, such as icons, shapes, photographs, illustrations, and 3D objects. Users can upload visual content themselves or use the built-in Pexels media library. The editor offers blocks for citations, notes, lists, tables, collages, hierarchical structures, and timelines. For highlighting key points or specific data, various blocks are available—from discreet to bold and eye-catching. The service also offers a variety of chart types and automatically creates charts based on the selected template and the uploaded data. Additionally, outline maps of various countries and regions of the world are available, expanding the possibilities for information visualization.
The built-in AI assistant can create images upon user request and develop infographics on specified topics.
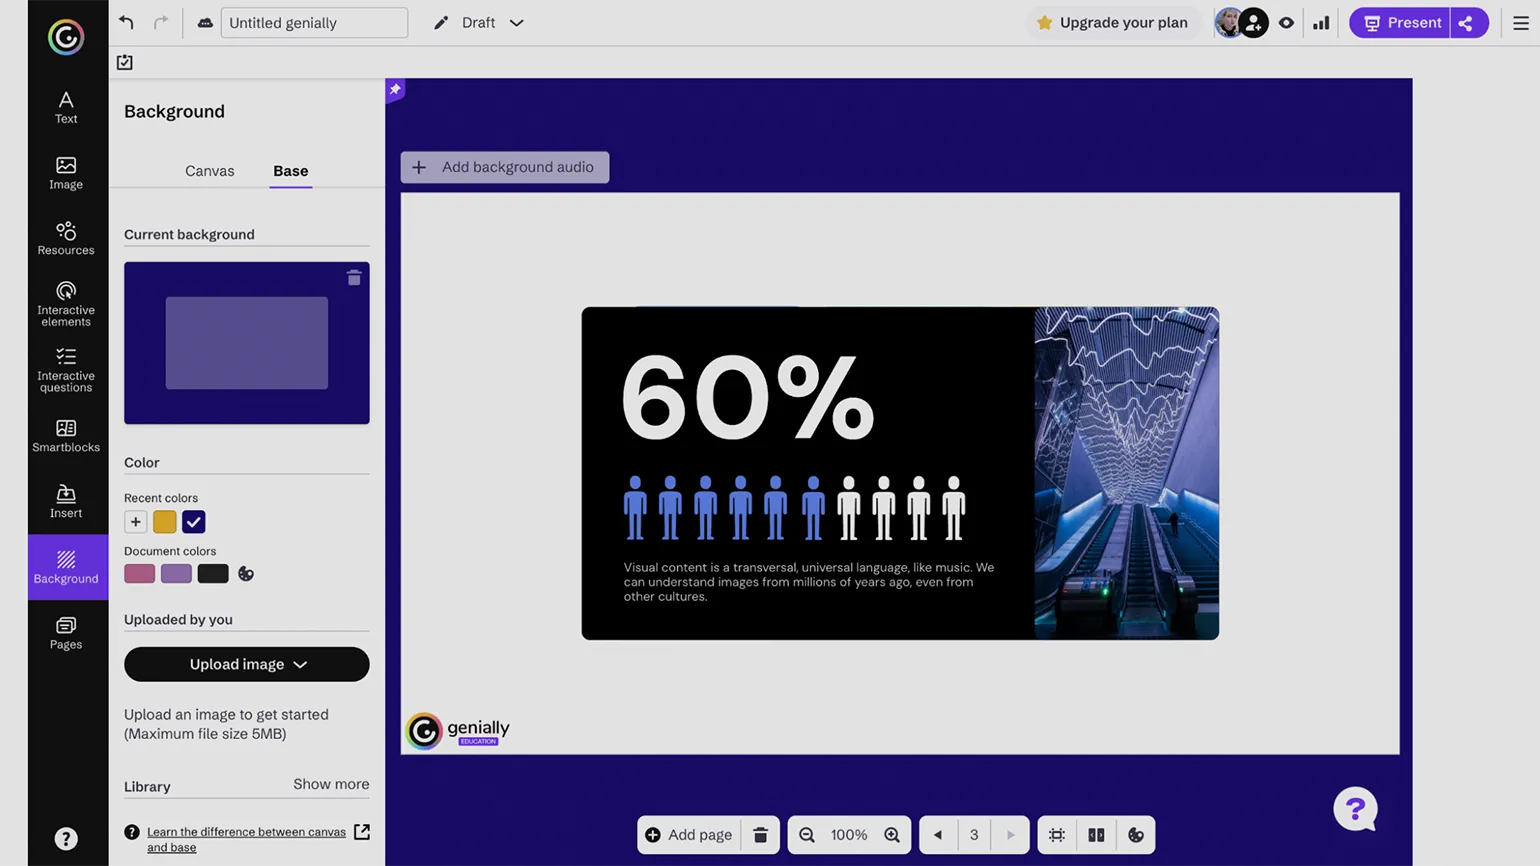
Genially
Registration is available via email, as well as using Google or Microsoft accounts.
Prices start at $7 per month.
The free plan has certain limitations. Users have access to basic templates and 2 GB of cloud storage. The maximum number of participants who can participate in synchronous activities, such as online quizzes, is 50. There is also no access to artificial intelligence-based tools. Users cannot download materials or share them via private links; access is possible only through public links that are indexed by search engines.
The interface is not available in Russian.
Our feature-rich platform offers a detailed guide to using Genially. This tool is ideal for creating interactive visual content, including presentations, infographics, timelines, quizzes, games, and branching quests. The service's core feature is animated and interactive elements such as buttons, tooltips, and images. You can also add quizzes to any content, significantly increasing its engagement and educational value. Genially opens up new possibilities for creating unique content that will capture your audience's attention. You can start creating from scratch or use one of the many available templates. Each template is easily editable, allowing you to add tables, charts, graphs, maps, illustrations, and text blocks to your pages. Special templates and a library of pre-made objects are available for different types of elements, allowing you to choose suitable characters and icons to match your visual style. This makes the content creation process more convenient and efficient, allowing you to focus on the originality and quality of the material presented.
Snappa
Registration is via email. This process allows users to quickly and conveniently create an account. Enter your email address and follow the instructions to complete the registration. Make sure you use a current and accessible email address, as a registration confirmation will be sent to it. Once confirmed, you will have full access to the site's functionality.
The service starts at $15 per month, with the possibility of receiving a discount by paying annually in advance.
The free plan has limitations: users can upload created materials only three times a month. However, the publishing function with access via a link is not available.
The interface is not available in Russian.
This service does not offer extensive design functionality, but it copes well with simple tasks. It is ideal for creating memos, informational posters, and checklists. Its ease of use makes it a convenient tool for basic design tasks.
Snappa offers nearly 60 infographic templates, allowing users to flexibly customize each element. The platform offers basic visual elements such as icons, shapes, illustrations, and photos from the Unsplash collection, as well as the ability to upload your own images. However, it's worth noting that Snappa lacks templates for charts, tables, and timelines, as well as tools for more complex data visualization and AI-powered features.
Read also:
- Free services for creating a timeline
- Creating online courses: a selection of designers that allow you to do this
- A selection of designers and worksheet generators for teachers and tutors
- Principles of multimedia learning that help create digital educational content