
Course with employment: "The profession of a Methodologist from scratch to PRO"
Find out moreWhat is an empathy map
An empathy map is an important tool in the product approach to education. It helps you better understand the needs, emotions, and thoughts of your target audience, which contributes to the effective design of new or improvement of existing educational products, such as training courses. Methodologists and educators use empathy mapping at various stages of development to better tailor content to learners' needs and expectations. This tool helps create a more holistic and user-focused product, which in turn increases its relevance and effectiveness.
- Research your audience during the pre-development stage — the map will help you systematize the collected information and identify patterns.
- Seek and select design ideas — analyzing the map will suggest which teaching methods and tools are suitable for the course, what should be included in the Student Journey Map, and even what communication style to use in educational materials and in communications with students.
- Confirm or refute your hypotheses — the map will make your research more objective and avoid cognitive biases. In a large data stream, it is easy to miss information that does not seem important to you, but is actually of fundamental importance. Visualization helps with this.
- Auditing a completed course—using a map, you can visualize the data collected after the first rounds and conduct a more in-depth and comprehensive analysis.
The importance of this last point cannot be underestimated: with an abundance of data, it's easy to miss or ignore important information, especially if it doesn't align with the original concept. However, such information can be critical, and data visualization can help reveal its significance. Effective visualization techniques help highlight key aspects and make them more visible, which facilitates deeper analysis and informed decision-making.

Read also:
Creating curriculum with a student focus is the key to successful learning. It is important to consider the needs and interests of students to make the learning process more effective and engaging. Here are eight methods to help you achieve this goal.
The first method is to conduct regular surveys with students. This will help you understand their preferences and desires regarding the course content. The second method is to integrate practical tasks that connect theory with real life. This makes learning more relevant and interesting.
The third method is to use technology. Interactive elements such as videos and online platforms can significantly increase student engagement. The fourth method is to create group projects that encourage collaboration and exchange of opinions among students.
The fifth method is to individualize the learning approach. Consider different learning styles and paces of learning. The sixth method is to provide feedback. Regular assessment and constructive comments will help students understand their strengths and weaknesses.
The seventh method is to incorporate game elements into the learning process. Gamification helps make classes more attractive and motivating. The eighth way is to create an inspiring learning environment that encourages creativity and critical thinking.
Using these methods will allow you to create learner-centered curricula, which will improve learning outcomes and increase student satisfaction.
What an Empathy Map Looks Like
There are several types of empathy maps, which differ only in minor details. However, these differences can be significant for achieving the goals of your map. In this article, I will look at three examples of empathy maps that will help you better understand the needs and thoughts of your target audience.
A consumer map is one of the most effective tools for quickly analyzing your target audience. This method is excellent for brainstorming and allows you to quickly assess the needs and preferences of customers. However, it is worth noting that a consumer map does not provide a complete picture of the target audience. For a deeper understanding of consumers, it is recommended to use additional research methods.
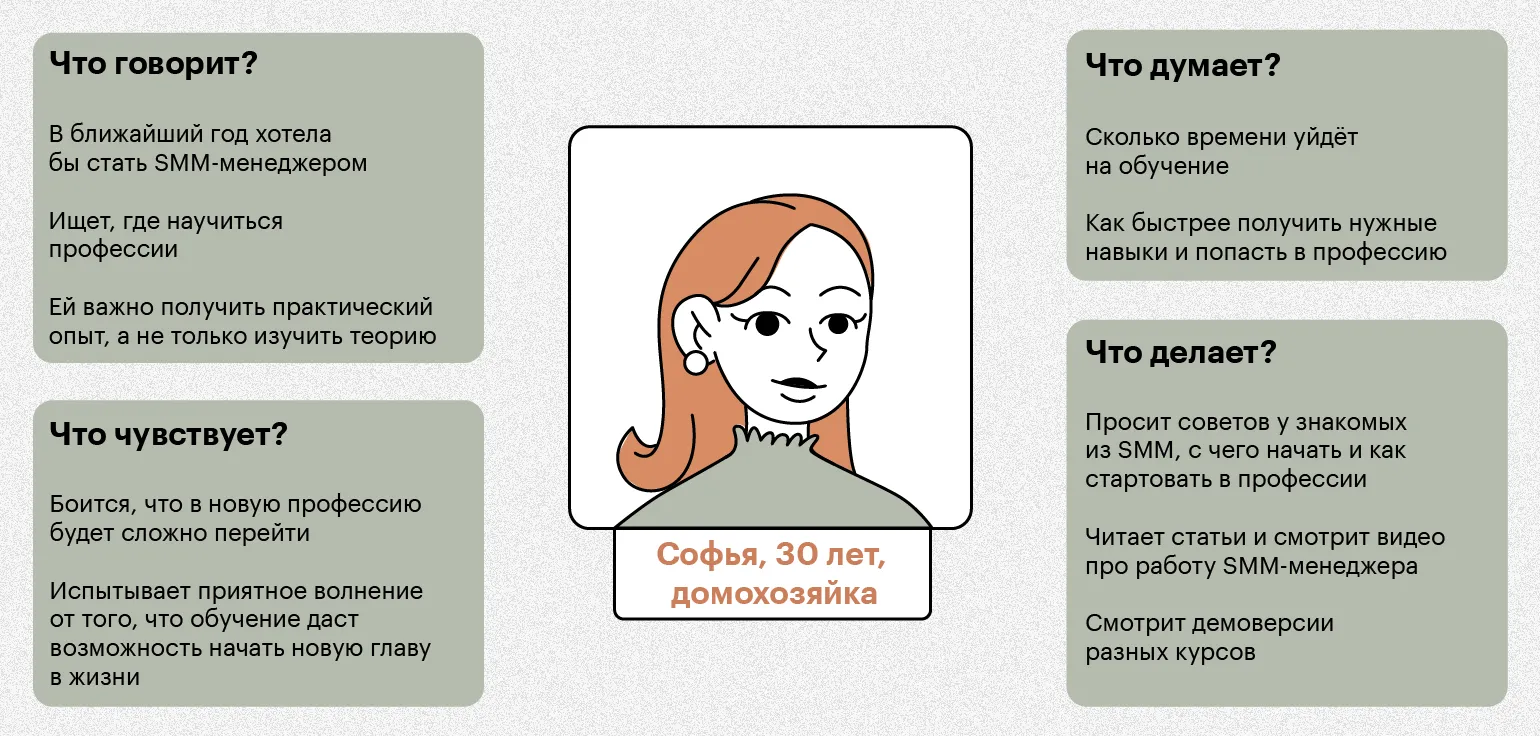
The map includes four blocks that describe in detail the typical representative of the target audience of your educational product. These blocks will help you better understand the needs and interests of your target audience, which in turn will allow you to more effectively adapt content and marketing strategies. By analyzing the characteristics of the target audience, you will be able to create more targeted and relevant offers, which will increase the attractiveness of your product in the educational services market.
- what he/she says,
- what he/she thinks,
- what he/she does,
- what he/she feels.
Each research block offers significant flexibility in filling out, which allows you to adapt the content depending on the goals. For example, if your goal is to create a portrait of a typical representative of the target audience of retraining courses, you should find out the following key aspects:
First, determine demographic characteristics such as age, gender, level of education and professional experience. Next, study the motivation of the participants: what motivates them to take retraining courses? This may be a desire to improve their skills, change professions, or adapt to changes in the labor market.
It is also important to understand their learning preferences: what formats and methods of learning does your audience prefer? For example, these may be online courses, practical classes, or blended learning. Understanding these factors will help you create a more targeted and effective course program that meets the needs of your audience.
Don't forget to take into account possible barriers that your target audience may face, such as financial constraints or lack of time. This will allow you to offer a more accessible and attractive learning environment.
- What these people say - that is, how they see changing their profession;
- What they think - why they even thought about it, why they need it;
- What they do - what steps they have taken, what courses they have already completed or what materials they have studied;
- What they feel - what emotions they experience about changing professions and training.
An example of the map is presented below. This image illustrates what the map might look like in this context.
Now let's consider a situation where you are auditing a course to update it. In this case, the structure of the questions will be as follows:
- What they say — what was the students' experience like, why they chose the course and for what purpose;
- What they think — what their opinion of the course was, what was useful and what was not;
- What they do — whether they take the course, completed it or dropped out, whether they apply the knowledge or not;
- What they feel — how their motivation changed throughout the course, what emotions they experienced at the beginning and throughout the course, what they are experiencing now and why.
As a result, you will have a clear picture of user needs, which will allow you to compare this data with your initial perceptions or with stakeholders' opinions of user desires.
The star map provides a clearer picture of how both prospective and current students think and feel. Although it is similar to the previous model, it includes two additional dimensions. The map structure consists of the following sectors:
- what is heard;
- what is seen;
- thoughts and feelings;
- words and actions;
- problems;
- values.
The first four sectors logically reflect the consumer map. New elements are the "Problems" and "Values" sections. These sections provide valuable information necessary for program implementation using the product approach. The main goal of this approach is to meet the needs of users, which implies solving their problems.
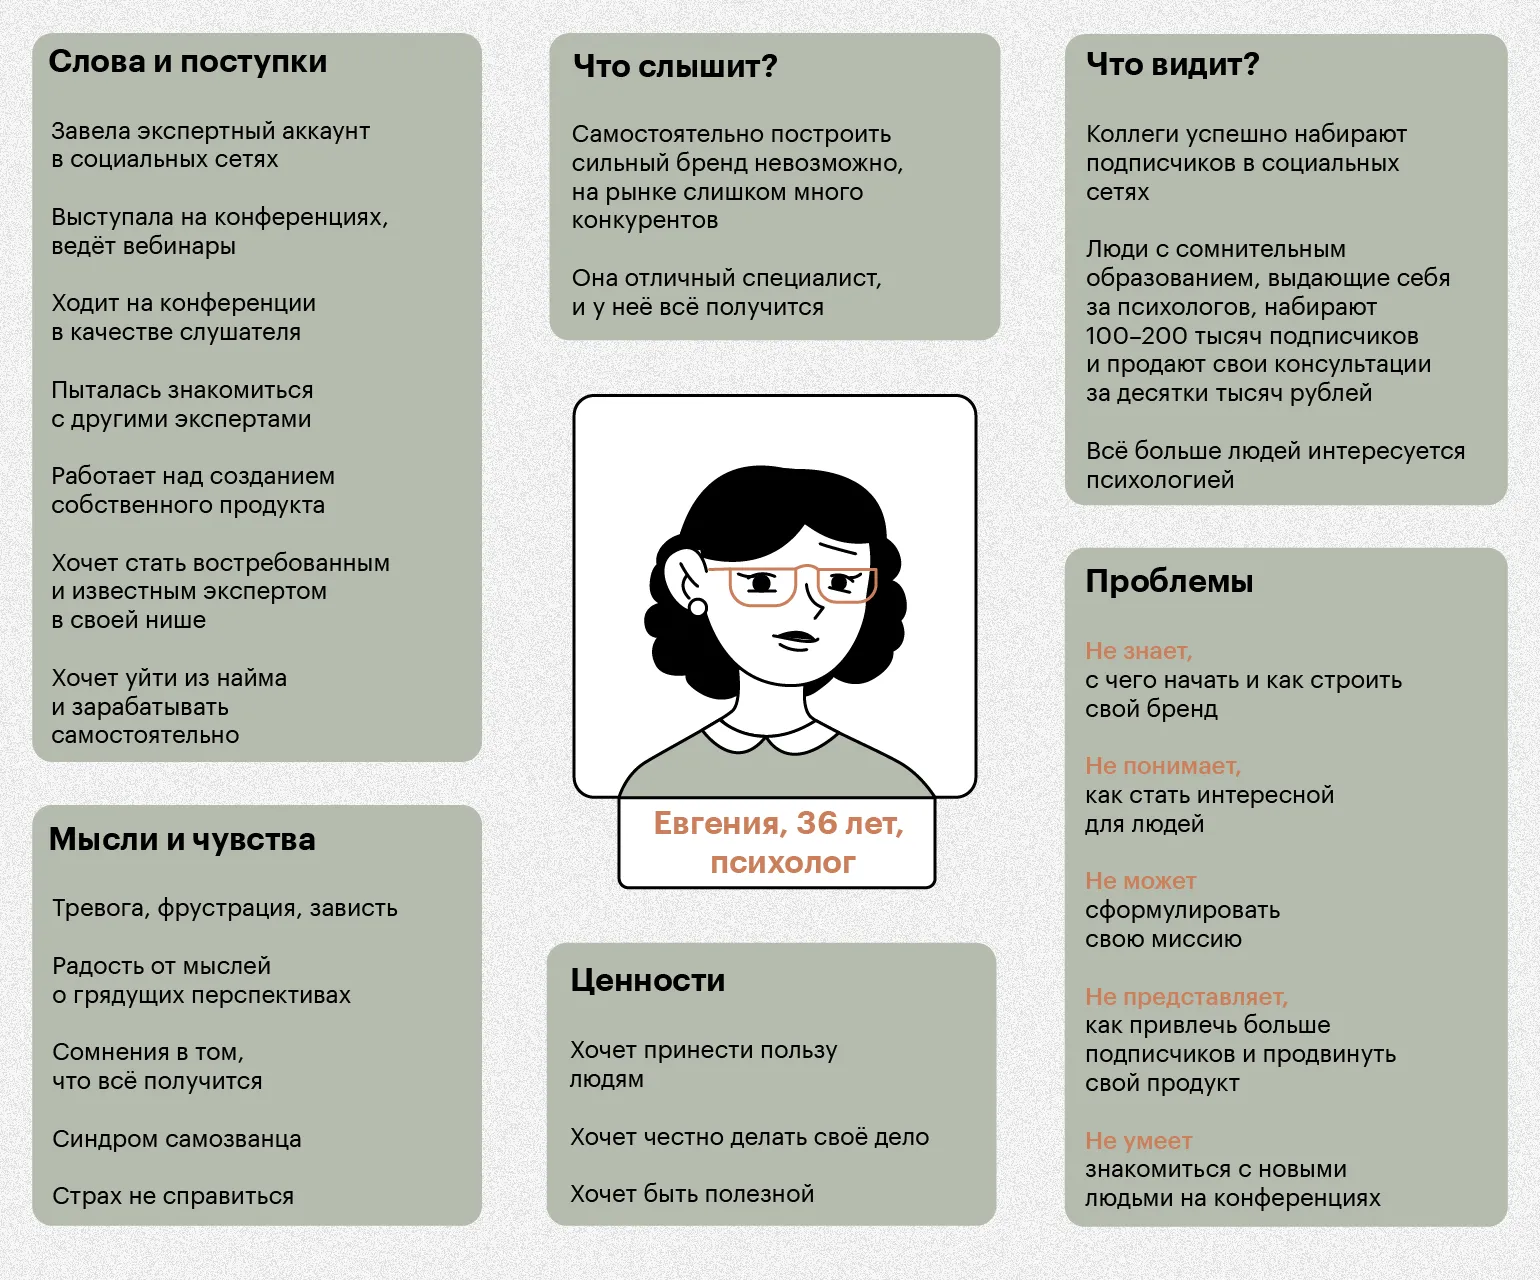
Problems include all factors that hinder the audience Achieve your goals. For example, Andrey wants to become a sought-after IT specialist and increase his income. However, he lacks the necessary skills, has only had superficial contact with the industry, and doesn't know how to start a career in this field. This is his main problem. Values help determine how he will evaluate the success of his learning and how we can improve his educational experience. For example, it is important to Andrey that the training be practice-oriented, that the instructors include experienced professionals actively working in the industry, and that he has the opportunity to ask questions and receive support from mentors.
In the product approach, the concepts of "Problems" and "Values," sometimes referred to as "Pains," are often complemented by diagrams. Unlike the first four quadrants, which can undergo significant change, these aspects remain more stable. However, learning as a product is a dynamic process, making constant updating and adaptation of information necessary.
Dave Gray's map, also known as the Osterwalder map, is an advanced version of the star map. It is designed for in-depth audience analysis and allows for a complete picture of the target group. This visualization tool helps identify key user characteristics and needs, which is especially important for successful marketing and product development. Visually, the map has a specific structure that facilitates the perception of information and promotes more effective strategy planning.

The diagram is depicted in the center The head symbolizes the map's core concept: it visualizes the processes occurring in a person's mind. The map's author, Dave Gray, is a former designer and founder of Xplane, a strategy consulting firm. He also wrote the books "Gamestorming: The Games Business Plays" and "Liminal Thinking." Gray placed the "Think and Feel" block within the head to emphasize the distinction between observable phenomena occurring outside of consciousness and internal thoughts and feelings that can only be inferred but not directly observed. This framework serves as an effective tool for analyzing thinking and understanding emotional processes, making it useful in the fields of business strategy and personal development.
Some elements are repeated in previous versions of the empathy map, but we will still consider each step in the given sequence.
- Step 1. Who we are working with - at this stage, we describe the demographic, geographic, and social characteristics of the target audience and provide a portrait of the people we are teaching or will teach.
- Step 2. What they need to do - we describe what should change in the behavior, knowledge, and skills of students (essentially, we formulate the educational goal). Here you can also write down the criteria and metrics that will allow you to evaluate the result.
- Step 3. What they see — this section describes what our respondents see around them and how they see learning.
- Step 4. What they say about learning — this section includes all their thoughts and impressions about the course or about learning.
- Step 5. What they do — we describe what steps students are already taking to achieve the goal (for example, are they already learning from free videos on the Internet or are they attending specialized conferences to learn more about the topic, if we are talking about corporate training).
- Step 6. What they hear — we describe what they hear about the problem you are considering. For example, you are creating a career course for beginners: what does their circle say about such a step? This will allow you to better understand the emotional background. Here, you can also ask how people learned about your course—this is a useful resource for future training design and for adjusting your marketing strategy. In corporate training, you can ask other questions: for example, what kind of feedback does the employee receive from clients and management? This will help both you and them identify areas for growth.
- Step 7. What they think and feel / what are their pain points and benefits—by this stage, it's important to analyze everything collected in the first six. This will help you understand the audience's problems (their feelings and fears) or, conversely, what will motivate them to pursue their goals.
As a result, you will create a unique selling proposition (USP) for your program and also create a foundation for developing attractive mechanics. These mechanics will help convince potential customers that your product is exactly what they are looking for.

Mapping is not an independent study, but a tool for generalizing and systematizing the information obtained during the research. For a map to function as an effective tool, it's essential to conduct high-quality research, ensure the completeness of the collected data, and use a representative sample. This will improve the accuracy and usefulness of the final map, which in turn will enhance understanding and analysis of the topic under study.
Now let's look at how to properly create a map and collect the necessary data for its creation. Map creation begins with defining the goals and objectives you want to achieve. Then, you should choose a suitable data visualization tool. This can be either specialized software or online services.
Once you've chosen a tool, it's important to collect the data that will be included in the map. Make sure the information is current and reliable. Data sources can range from official statistical reports to surveys and research.
Next, structure the collected data so that it's understandable and logical. After that, you can move on to visualization, adding necessary elements such as labels, legends, and explanations. It's important that the map is not only informative but also easy to digest.
Once you've completed the map, test it with your target audience to ensure its effectiveness and clarity. This way, you can optimize the information and make it more accessible to users.
How to Create an Empathy Map
Creating an empathy map involves several key steps. First, you need to define your target audience to understand the needs and desires of users. Then, you should collect user data through surveys, interviews, or analysis of existing research. The next step is to visualize the information by breaking it down into key categories: what users think, feel, see, hear, and do. This will help you better understand their emotions and motivations. Once you've created the map, it's worth analyzing the data and using it to improve your products or services, which in turn will help increase customer satisfaction and loyalty.
An empathy map is ideal for analyzing a specific course, but it's not a universal tool for your entire product line. The purposes for using the map can vary: you could be updating an existing course, developing a new one, generating ideas, or seeking a deeper understanding of your target audience.
At this stage, it's important to clearly define the target audience. This will allow you to more effectively adapt your content and promotion strategy, ensure maximum relevance, and increase user engagement. Understanding the needs and interests of your audience will help you create higher-quality and more engaging content, which in turn will improve your rankings in search engines.
At this stage, it's necessary to collect as much data as possible about your target audience. Surveys, reviews, and in-depth interviews are ideal for this. The quality of the research conducted plays a key role. We recommend using the following workflow:
- Start with in-depth interviews: they will help you better understand your audience, uncover the topic of interest, and gain insights that standard surveys cannot provide. Furthermore, unlike mass surveys, you will have the opportunity to immediately clarify certain points and better understand your interviewees. The more people you interview, the greater the chance of finding common patterns in their responses. Also, remember that it is impossible to draw conclusions based on the words of two or three people—most likely, their opinions will differ greatly.
- At this stage, you can already record key phrases on an empathy map. Analyze how complete the map is—you will surely notice gaps.
- Supplement the obtained data with questionnaires for a wider audience. First, this will allow you to test the typicality of the insights obtained from a small group during in-depth interviews on a larger sample. Secondly, this is an opportunity to clarify any points that were not entirely clear or not covered during the interview.
- If you are conducting an audit, also analyze the feedback and look for common, recurring opinions. You will most likely have to exclude isolated responses—it is important to quantitatively confirm any existing opinion about the course.
Analyze the collected data for patterns, similar wording, opinions, and emotions. It is important to identify all the factors influencing the behavior and decisions of your target audience. After completing the analysis, transfer the information to a visual map. Place an image or description of the target audience in the center, and highlight the aspects that influence them around it. These can include factors such as values, beliefs, fears, desires, and needs. This approach will help you better understand your audience and optimize your marketing strategies.
While this step is optional, I highly recommend discussing the map with colleagues, if possible. This will help you ensure you are moving in the right direction and identify potential improvements to the map. Discussing with the team can lead to new ideas and a better understanding of the common goal, which will ultimately improve the quality and effectiveness of the map.