
Contents:
- How to conduct a general analysis of a company
- How to analyze a company's financial statements
- How to evaluate dividend policy
- What multiples to evaluate
- How to analyze the prospects and risks for a company
- Why analysis may not help
- The main thing about how to evaluate a company's shares, in 5 points
- How to learn more about investments

Learn: Personal Investing
Learn MoreHow to Perform a General Company Analysis
First, you need to thoroughly study the available information about the company. It is important to understand what it does, what its production volume is, and also familiarize yourself with its development strategy. It is useful to know how the company is assessed by rating agencies, whether there are any sanctions imposed on it, and other key facts. For analysis, you can use the company description in the brokerage app or turn to specialized services, such as TradingView, which provide up-to-date data and analytical materials. This will help you get a complete picture of the company and its position in the market.
It is important to evaluate the cyclicality and technological development of the company, as this will help identify its potential for growth and changes in the share price. Analyzing these factors helps to more accurately forecast financial performance and business sustainability in market conditions. Cyclicality is an important aspect in analyzing companies' financial performance. Cyclical companies' revenues are subject to fluctuations due to changes in the economic environment. In contrast, non-cyclical companies demonstrate more stable results that remain unchanged regardless of economic conditions. This makes non-cyclical companies more predictable for investors, as their revenues are not dependent on economic cycles. Therefore, understanding cyclicality and its impact on company revenue can help investors make more informed decisions. When choosing shares of a cyclical company, it is recommended to buy during periods of declining revenue and profits, when the shares become more affordable. If you are considering long-term investments for more than 10 years, the company's cyclicality may not play a key role. In such cases, stock purchases can be made regardless of the current stage of the cycle. The key is analyzing the financial condition of the business, which will influence your investment strategy.
Technology defines companies that actively use and develop new technologies. This applies to both manufacturers and implementers of innovative solutions. Examples of such companies include IT giants Apple, Google, Tesla, and Amazon, as well as Russian leaders such as Yandex and Sber. These organizations not only create new products but also introduce advanced technologies into everyday life, improving the quality of services and increasing the efficiency of business processes. Technology is becoming a key factor in competitiveness in the modern market.
Technology companies typically do not pay dividends, as they focus on reinvesting profits for further business development. This allows their shares to grow in value faster than shares of companies that do not invest in technology and innovation. Investors interested in long-term capital growth often prefer shares of technology companies, as they may offer higher prospects for value increase.
Let's analyze the company "Severstal". Severstal is one of the largest mining and metallurgical companies in Russia, producing approximately 18% of all steel in the country. The company successfully combines modern technology and sustainable development, allowing it to occupy a leading position in the market. In its activities, Severstal emphasizes environmental responsibility and the efficient use of resources, making it attractive to investors and partners.
The company includes a number of manufacturing facilities, including the Cherepovets Iron and Steel Works, the second-largest steel mill in Russia. The company's structure also includes sales and logistics divisions, gold mining enterprises, service and repair companies, and the Severstal-Project design institute. These enterprises provide a comprehensive approach to the production and distribution of metallurgical products, making the company a leader in its industry.
Severstal has established itself as a reliable player in the market. In 2019, it received a high ruAAA rating from Expert RA, which is confirmed annually. In 2021, Severstal ranked 16th in Forbes magazine's ranking of the 200 largest private companies in Russia, with an impressive revenue of 495 billion rubles. In 2024, ACRA confirmed the company's status, assigning it an AAA (RU) rating. This stability and industry recognition underscore Severstal's reliability and financial strength.
The company's shareholding structure is distributed as follows: 77.03% of the shares are controlled by Alexey Mordashov, while 22.97% of the shares are available for free float on the market.
The company is subject to sanctions. On June 2, 2023, Alexey Mordashov and his affiliated companies, including Severstal, were added to the US sanctions list. On August 22, 2023, the company was also placed on sanctions lists by Canada and other countries. Nevertheless, Severstal successfully adapted to the new conditions: its domestic sales share increased from 50% to 90%. This demonstrates the company's ability to effectively respond to challenges and find new opportunities for growth in a limited environment.
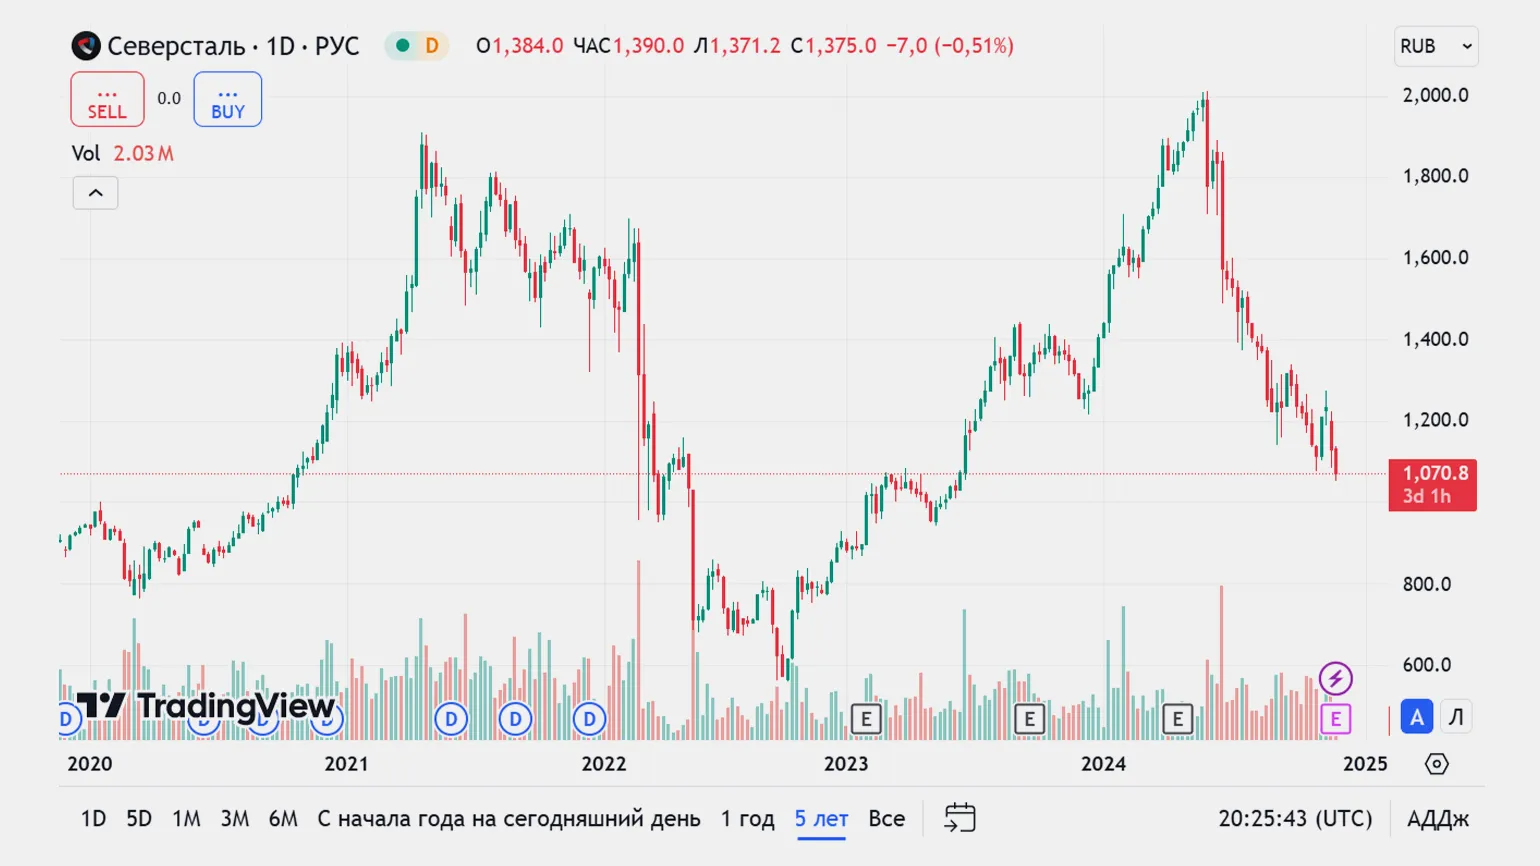
In May In 2024, Severstal shares reached a record high, exceeding 2,000 rubles per share. However, since then, the share price has fallen significantly, almost halving. As of November 27, 2024, Severstal shares were trading at 1,070 rubles. This sharp decline in share prices may be related to market changes and economic factors affecting the metals industry. Analyzing current trends and factors affecting Severstal shares can help investors make informed decisions. Skillbox investment courses offer a unique opportunity to immerse themselves in the world of finance and learn how to effectively manage their investments. The course program covers key aspects of investing, including market analysis, asset selection, and strategic planning. Participants will gain access to relevant knowledge and practical skills to help them make informed financial decisions. The training is delivered in a convenient format, including video tutorials, hands-on exercises, and support from experienced mentors. After completing the Skillbox courses, you will be able to confidently invest and create your own asset portfolio, which will help you achieve financial independence.
- "Personal Investing" - learn how to create an investment portfolio from scratch and make money by investing in securities.
- "Trading" - make stock trading your main source of income.
How to Analyze Company Financial Statements
Companies whose shares are traded on the stock exchange regularly publish reports on their activities. These reports can be roughly classified into three categories: financial, operational, and auxiliary. In the next section, I will tell you where to find the necessary reports, and then explain how to analyze them correctly.
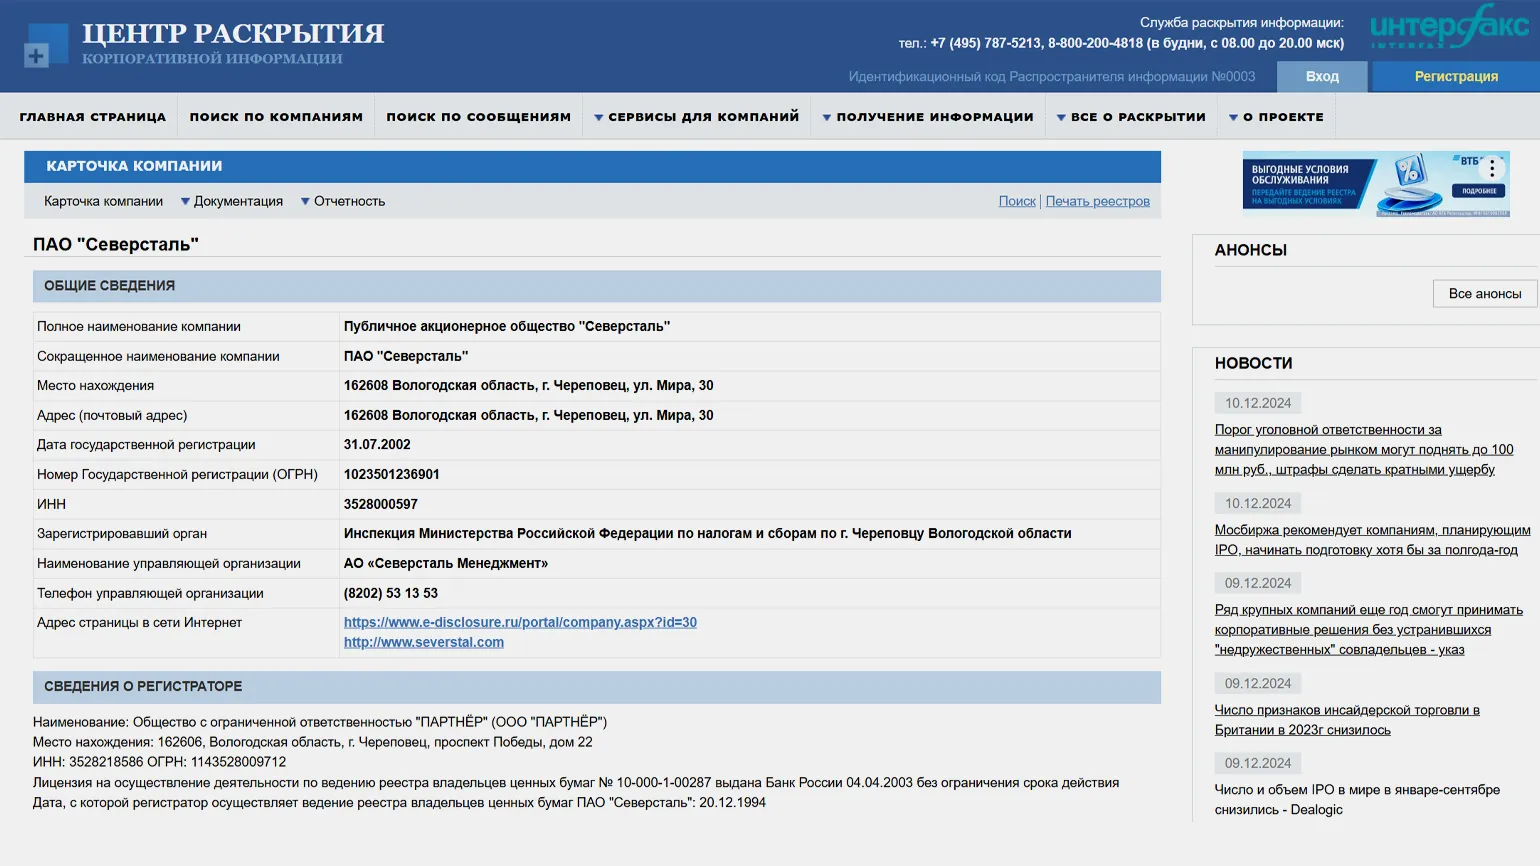
A company is required to publish financial and operational reports at least once a year, providing investors with information on its performance for the previous year by the end of April. Reports include quarterly, half-yearly, nine-month, and annual data. Businesses publish these reports on the Moscow Exchange website, as well as on their official websites in sections intended for investors. For example, Severstal has a dedicated page for publishing such information.
Russian companies that have listed their shares are required to publish financial reports in the Corporate Information Disclosure Center. Reports can be found using the company name or its Taxpayer Identification Number (TIN). This is an important source for investors, allowing them to obtain up-to-date data on the financial condition of companies and assess their investment attractiveness.
Companies are required to post important information on the websites of accredited news agencies that are supervised by the Bank of Russia. This requirement is aimed at ensuring transparency and accessibility of information for all stakeholders. Publication of data on such platforms helps increase trust in companies and improves customer awareness of their activities.
- Interfax - Corporate Information Disclosure Center;
- Prime Economic Information Agency;
- Comprehensive Information and News Disclosure System (SKRIN);
- Association for the Protection of Investor Information Rights (AZIPI);
- Closed Joint-Stock Company Analysis, Consulting and Marketing (AK&M).
Accounting statements can be found on the official website of the Federal Tax Service. It provides up-to-date information for taxpayers, including reporting forms and important updates. By visiting the Federal Tax Service website, you can access the data you need for accounting and tax compliance.
There are many specialized resources that provide access to financial statements from various public companies. This is especially convenient for those who want to analyze data from several organizations simultaneously. These platforms allow you to quickly find the information you need, simplifying the process of researching and comparing financial indicators. Using these resources helps investors and analysts make more informed decisions based on up-to-date data.
Operational reports contain information about the company's activities, including production volumes, extraction volumes, and retail space growth. Such reports may also present sales data, allowing you to analyze the company's performance and identify trends in its development.
When evaluating, the following aspects should be taken into account. It is important to analyze the quality of the content, its relevance, and its relevance to the target audience. You should also pay attention to the structure of the text, the use of keywords and phrases, which will help improve visibility in search engines. Equally important is the analysis of metadata, such as titles and descriptions, which should be optimized to attract users. Additionally, it's worth evaluating page load speed and mobile responsiveness, as these factors impact user experience and website rankings. Attention to detail and continuous content improvement are key to achieving high search rankings.
- Production — is production volume growing; if not, why?
- Sales — are they growing; if not, why?
Comparing production and sales volumes with previous periods is a key aspect of analyzing a company’s performance. Observing trends, such as a consistent decline in volume over several quarters, may indicate a deteriorating company position, which in turn may lead to a decline in its stock price. In addition, it is important to compare with competitors’ performance to get a clear idea of which company is demonstrating the best results in the market. This approach allows not only to identify weaknesses but also to identify opportunities for improvement and growth.
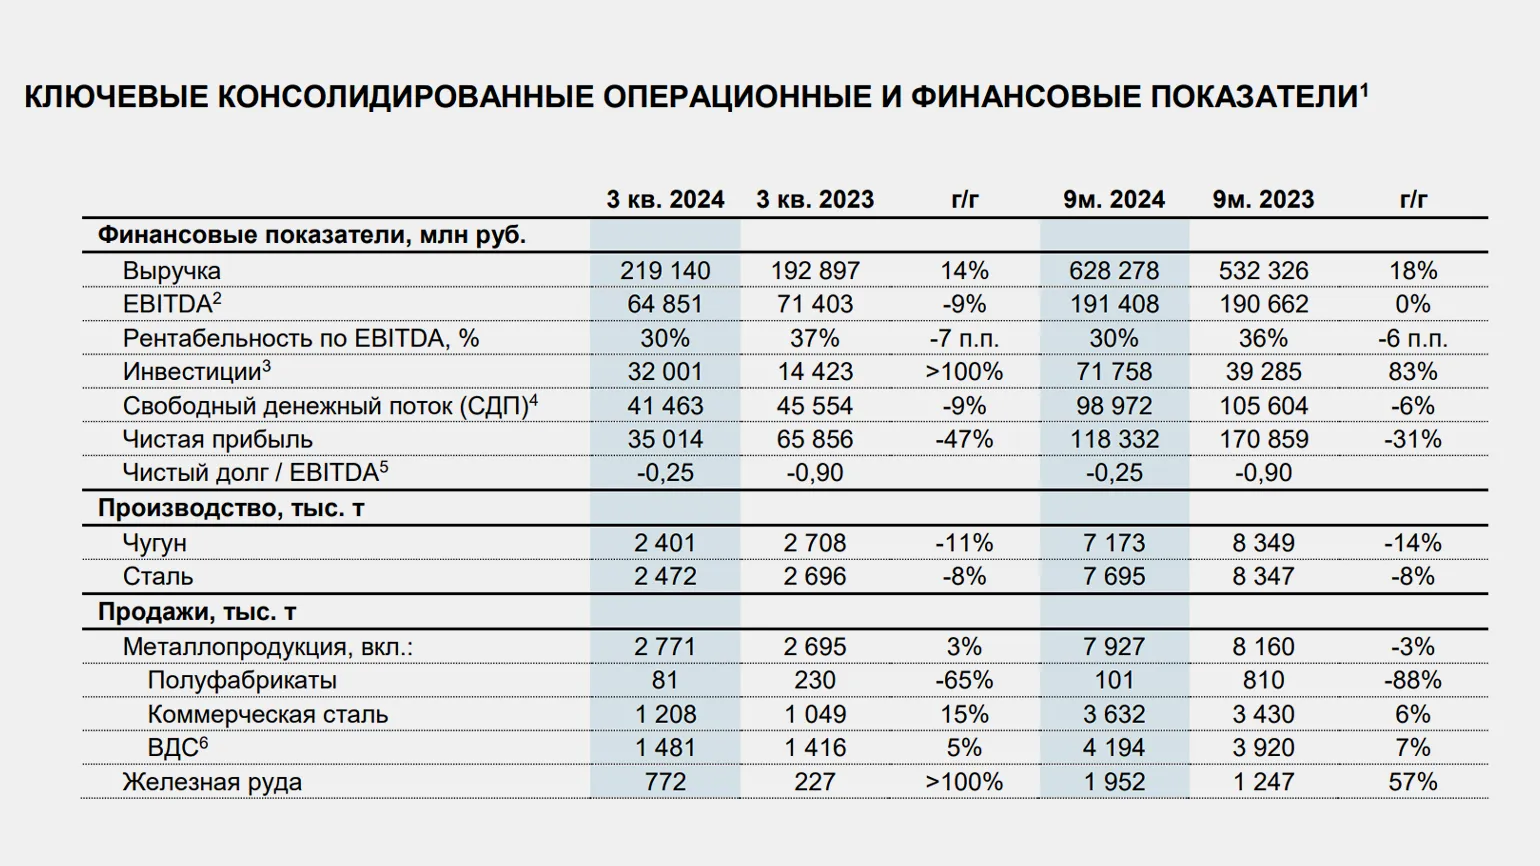
The consolidated financial statements of Severstal were published on October 21, 2024. These reports present the key performance results of the company for the nine months of 2024. The report contains important information on financial indicators, production results and strategic initiatives, which allows you to assess the current state and prospects of the company in the market.
When analyzing production performance, it is important to consider several key aspects. First, focus on the efficiency of resource utilization, including materials and labor costs. Second, it is necessary to evaluate productivity, which is measured by the volume of products produced in a given period of time. It is also important to analyze quality metrics to ensure product compliance with established standards. Equally important is monitoring the execution time of operations, which allows identifying bottlenecks in the production process. All these factors taken together will help improve overall production efficiency and enhance the company's competitiveness in the market.
- In the third quarter of 2024, pig iron production was expected to decrease by 11% and steel by 8% compared to the same period last year. This is due to repairs at the blast furnace and converter production.
- Sales of metal products increased by 3% year-on-year due to the consolidation of the results of A Group, acquired at the beginning of the year.
- Sales of pig iron and slabs decreased by 65% due to the repair of blast furnace No. 5.
- Products with high added value showed a 5% increase in sales, which indicates an increase in average selling prices.
Severstal's operating results demonstrate significant superiority compared to those of Magnitogorsk Iron and Steel Works (MMK). While MMK recorded a 26% decrease in production and a decrease in sales of almost 19%, Severstal maintains a more stable position in the market. The reasons for the decline in MMK's production indicators are related to scheduled repairs and a decrease in demand, which is caused by high interest rates and the cancellation of preferential mortgages. A comparison of these results highlights Severstal's resilience in the current economic environment.
Russian companies often publish two types of financial statements: those prepared under Russian Accounting Standards (RAS) and those prepared under International Financial Reporting Standards (IFRS). RAS statements are required by tax authorities and contain data on the historical value of assets, as well as key financial indicators. In contrast, IFRS statements take into account the market value of assets and the operating results of subsidiaries, providing a broader range of indicators. This makes IFRS statements more informative and useful for investors and other stakeholders.
When selecting key performance indicators, it's important to focus on a few key aspects. First and foremost, consider metrics that reflect user behavior on your website, such as number of visits, time spent on page, and bounce rate. This data will help you understand how engaging your content is and how it impacts your audience.
Also consider conversions and their sources. This will help you determine which channels bring in the most customers and which user actions lead to the desired results. Don't forget to track SEO metrics such as search engine rankings, number of backlinks, and organic traffic.
It's important to analyze data regularly to promptly adjust your strategy and optimize your content. By focusing on these key metrics, you can effectively improve your results and achieve your goals.
Revenue is a key indicator of a company's financial health, and its growth is a desired outcome for any business. A decline in revenue may indicate a decrease in demand for products or services, which, in turn, makes it difficult to maintain a stable profit level. This can negatively impact the company's stock price, as investors may begin to lose confidence in its prospects. Therefore, it is important to regularly analyze the factors affecting revenue and take measures to stimulate demand and improve competitiveness.
A decrease in revenue does not always indicate problems with the company. To gain a complete picture of financial performance, it's important to analyze this indicator in conjunction with other financial metrics. It's also worth considering additional materials and research that may shed light on the reasons for a decline in revenue. For example, this may be due to the launch of a new product or the acquisition of another company, which may temporarily impact financial results but lead to growth in the long term. Net profit is an important financial indicator that reflects a company's actual profit after deducting all expenses, including taxes and operating costs. Assessing net profit allows you to analyze the financial health of a company and its ability to generate income. Net profit dynamics over a certain period help identify trends of growth or decline, which may indicate the effectiveness of resource management and business strategy. Net profit margin, expressed as a percentage, allows you to evaluate a company's profitability and compare it with competitors in the industry. Regular monitoring of these indicators facilitates informed management decisions and improves financial performance. Net profit affects dividends—the higher it is, the larger the potential share payments. If net profit is negative, it means the company has incurred losses. This is typical for startups and early-stage companies.

Rework the text, but stay on-topic. Don't add anything extra. Adjust the text for SEO and add the content of the text. Don't use emoticons and extra characters. Don't add sections like 1. 2. 3. and *. Just provide plain text.
Read also:
Margin and Marginality: Definition, Differences, Calculation and Control Methods
Margin and marginality are key metrics in financial management that help evaluate a business's profitability. Margin is the difference between revenue and expenses, showing how much money remains after deducting all costs. Marginality, in turn, expresses this difference as a percentage of revenue, which helps understand what share of income is profit.
The difference between margin and marginality is that the former is an absolute value, while the latter is relative. To calculate margin, you need to subtract total costs from total income. The formula is as follows: Margin = Revenue - Expenses. The following formula is used to calculate marginality: Marginality = (Margin / Revenue) * 100%.
Monitoring margins and marginality is an important part of financial analysis. Regular monitoring of these indicators allows you to identify trends, evaluate the performance of various business areas, and make informed decisions to improve financial results. High marginality indicates effective cost management and successful pricing, which are the basis for sustainable company growth.
EBITDA, which stands for earnings before interest, taxes, depreciation, and amortization, is an important financial indicator. It allows you to evaluate the operating efficiency of a company and its ability to generate profit from core operations. This indicator helps investors and analysts understand how successfully the organization copes with financial obligations and can reinvest funds, for example, in equipment modernization or production expansion. Studying EBITDA helps draw informed conclusions about the financial condition of a company and its prospects in the market.
A positive and growing EBITDA indicator indicates the stability of the company's financial condition. On the contrary, a decrease in this indicator may indicate a deterioration in financial results. Negative EBITDA means the company is incurring losses, even before accounting for taxes, loans, and depreciation. It is important to understand the reasons for this situation in order to take timely measures to improve the financial situation. EBITDA analysis allows you to evaluate operating efficiency and identify areas requiring attention, which is a key aspect for investors and company management. Free cash flow (FCF) is a key financial metric that demonstrates the difference between cash flows from operating activities and capital expenditures. This metric helps assess the financial stability of a company and its ability to generate cash that can be used for reinvestment, dividend payments, or debt repayment. Although companies do not always report FCF in their financial statements, it can be easily calculated independently. To do this, subtract capital expenditures from net cash flows from operating activities. Free cash flow analysis helps investors and analysts better understand the financial health of a business and its potential for growth.
Free cash flow (FCF) is considered a more informative metric than net profit. An increase in FCF indicates a company's financial stability and its ability to effectively generate cash. Conversely, a decrease in free cash flow may indicate the presence of significant debt obligations. FCF analysis allows investors and analysts to better assess a company's financial health and its potential for further growth.
A company's debt obligations represent the amount that an organization has borrowed from banks or suppliers to support its operations. The presence of debt does not always indicate financial problems. On the contrary, the prudent use of borrowed funds can contribute to business development, increase liquidity, and finance new projects. It is important to analyze the ratio of debt to assets of a company to assess its financial stability and solvency.
When analyzing a company's debt obligations, it is important to consider the dynamics of their change. An increase in debt combined with an increase in profits does not cause concern. However, if the debt burden increases while profits decrease, this signals possible financial difficulties. A critical situation occurs when a company's liabilities exceed its assets. In such cases, investing in such a company can be risky, as it could lead to bankruptcy. Let's examine Severstal's financial statements. Analyzing financial data will allow us to better understand its economic condition and business performance. We'll examine key indicators such as revenue, profit, expenses, and assets. Understanding these aspects will allow us to assess the company's market prospects and its competitiveness in the industry. Severstal's financial statements reflect not only current results but also strategic goals, which is important for investors and analysts.
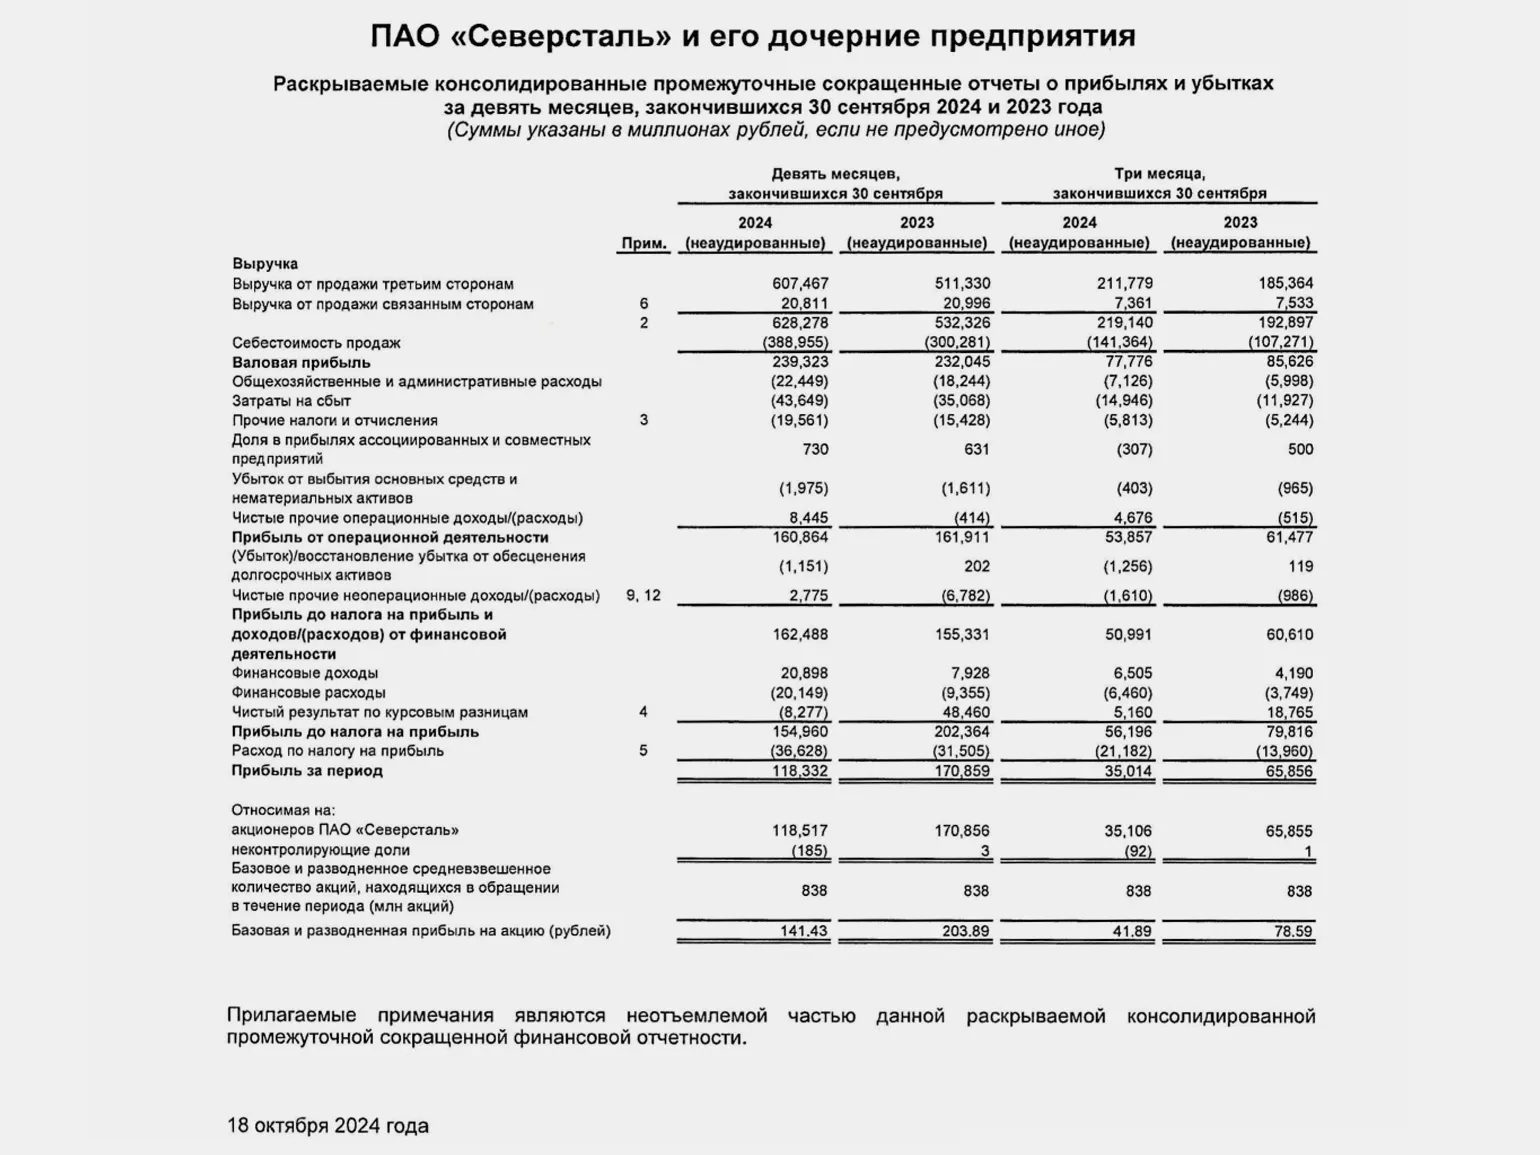
During the reporting period, the company achieved Revenue reached 628 billion rubles, an 18% increase compared to the same period last year. This result was the highest in the last three years. However, cost of sales also increased to 389 billion rubles, a 30% increase compared to the same period last year. Thus, there is a significant increase in both revenue and cost of sales, which may indicate changes in the market environment and the company's strategy. Net profit amounted to 118.5 billion rubles, a 30% decrease compared to the same period last year. This decline in profit indicates changes in the company's financial results and requires a careful analysis of the factors that influenced revenue dynamics.
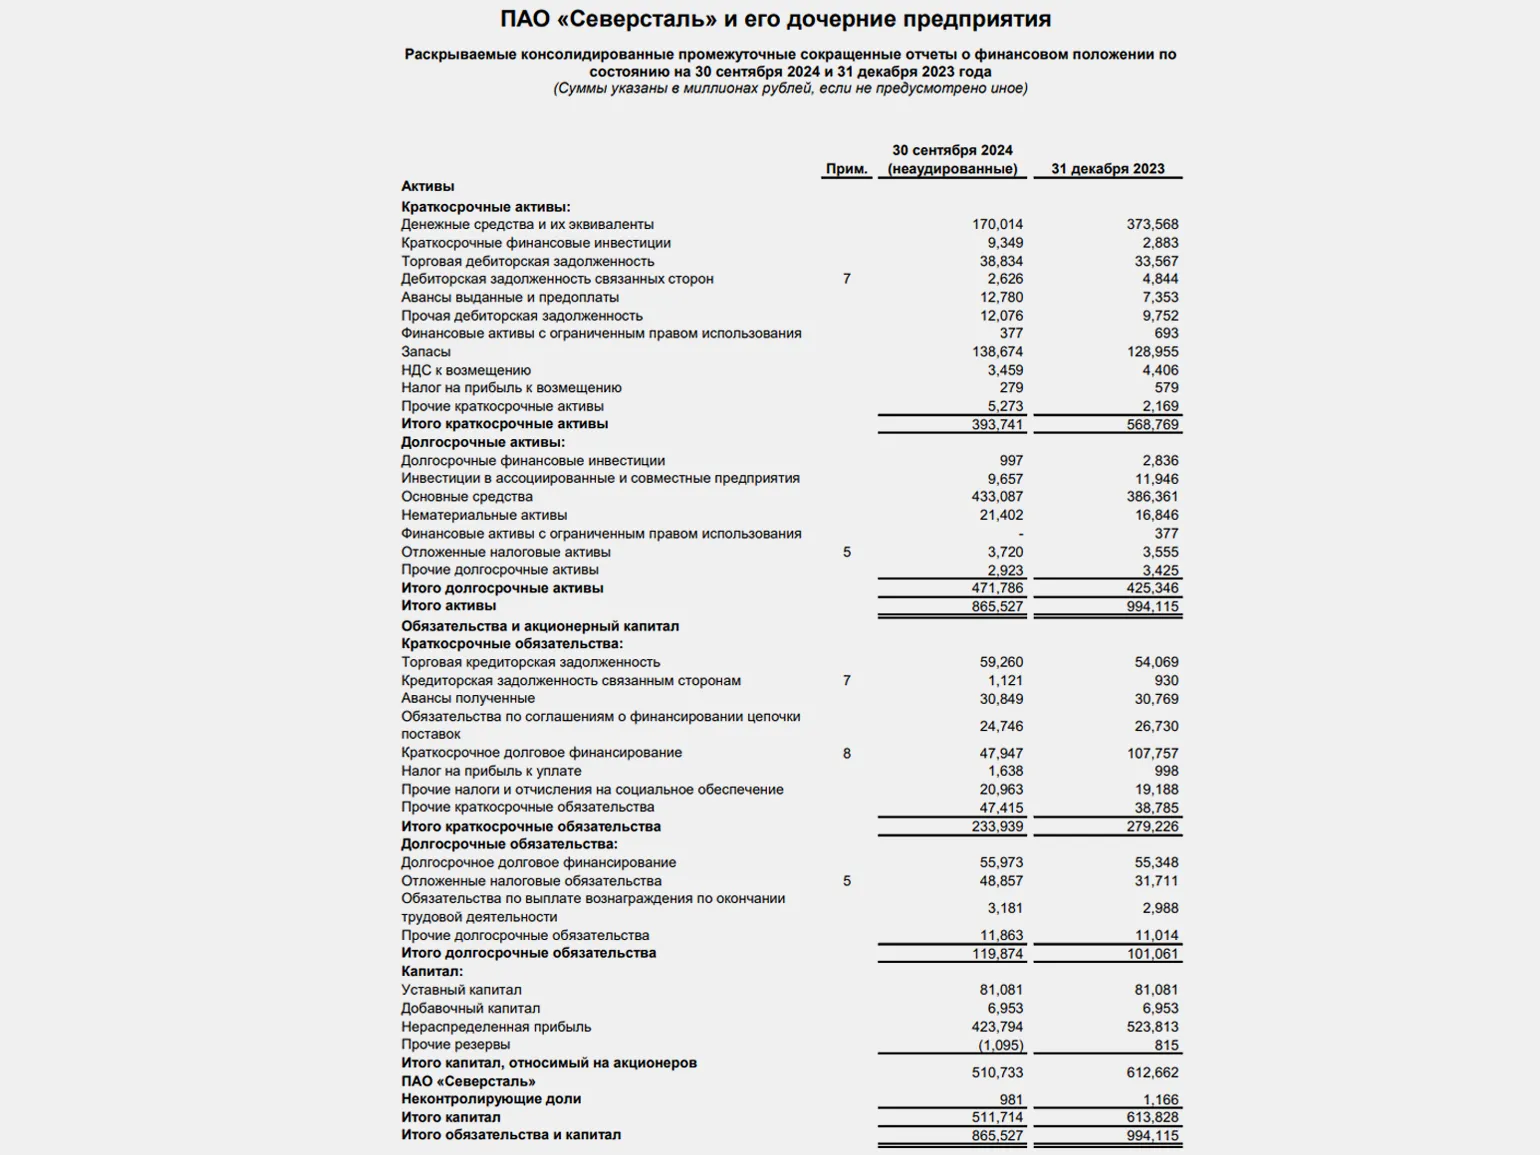
The total amount of loans and borrowings reached 104 billion rubles, which is 36% lower than the figures at the beginning of the year. The company's net debt currently stands at -66 billion rubles, indicating high financial stability and a favorable balance sheet position.
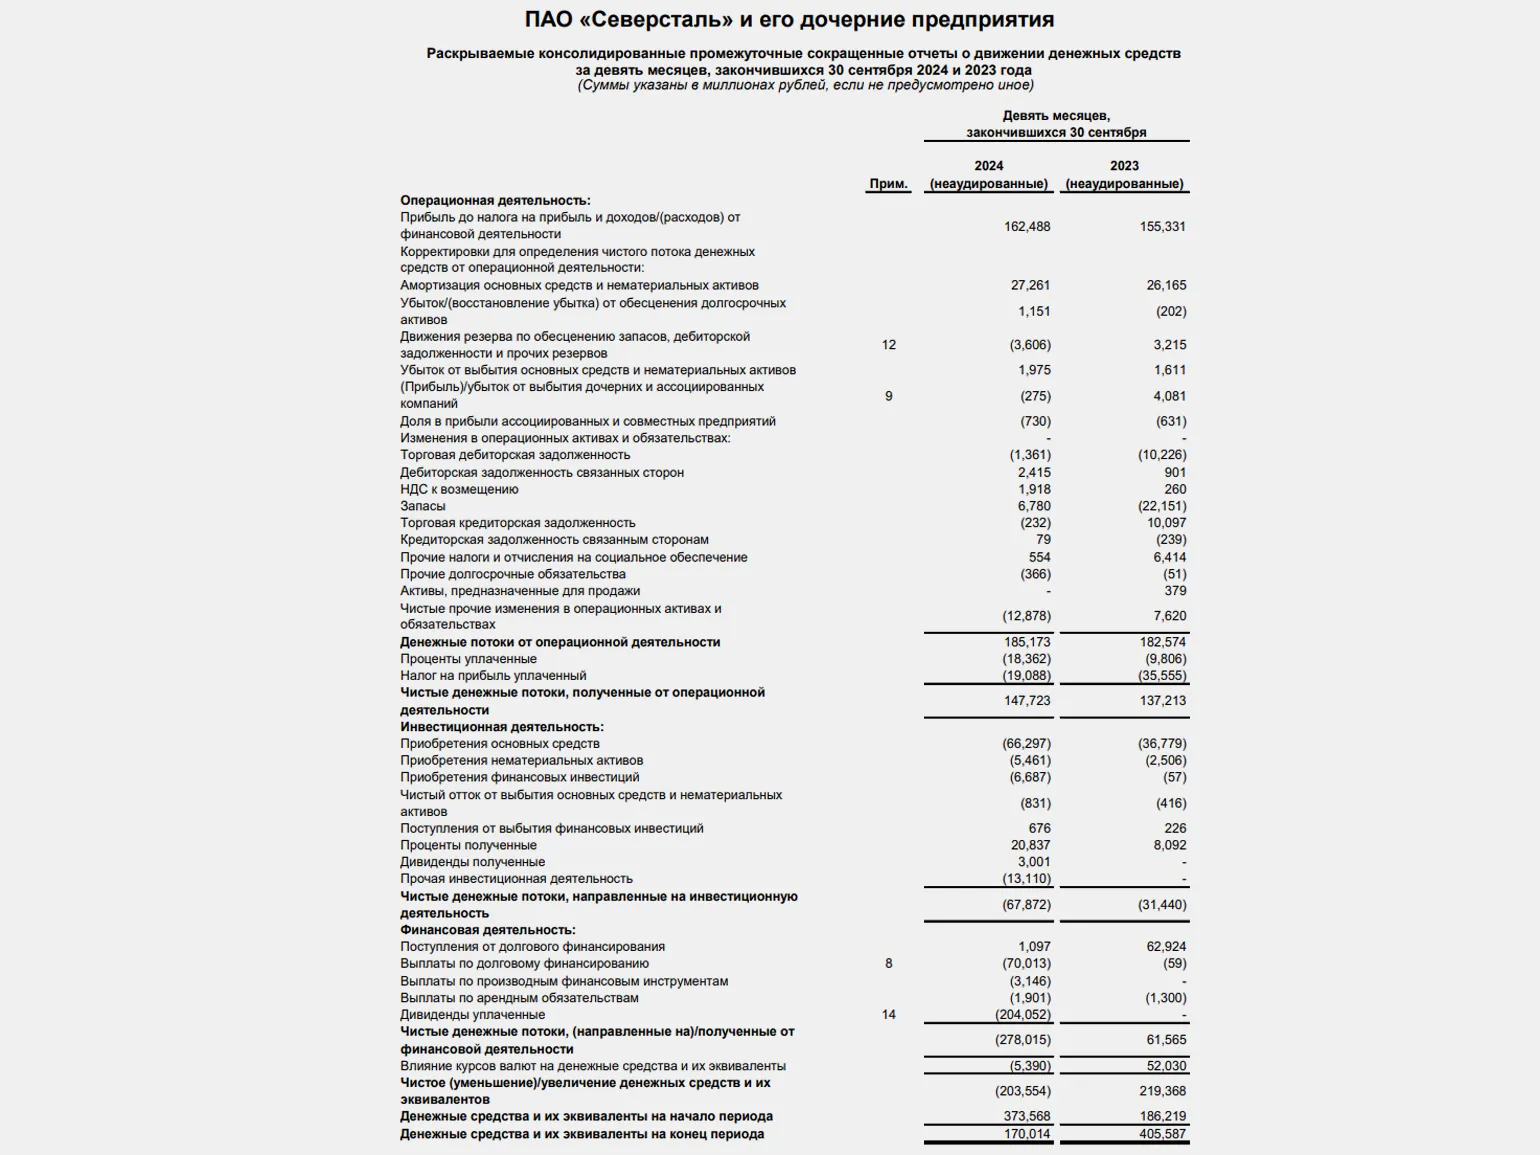
As of the end of the nine months of the current year, the company's free cash flow decreased by 9% and amounted to 41.46 billion rubles. This decrease is due to a decrease in EBITDA and an increase in investment costs. However, in the third quarter, operating cash flow reached its maximum level since 2022, and capital expenditures set a record, increasing 2.3 times compared to the same period last year. Despite the difficulties that arose, the company's free cash flow remained high, exceeding 41 billion rubles in the third quarter. This indicates the stability of financial indicators and the company's ability to adapt to changing market conditions.
The company demonstrates financial stability and does not face obvious problems.
How to evaluate dividend policy
Dividends are a share of a company's profits distributed among shareholders. Not all companies pay dividends, so it's important to familiarize yourself with the dividend policy before evaluating stocks that do. Knowing the dividend policy will help you understand the return you can expect from your investment. English: In addition, it is worth considering the stability and history of dividend payments, which can serve as an indicator of the financial health of the company and confidence in its future prospects.

Reworked text for improved SEO:
Explore additional materials:
Dividends are a portion of a company's profit that is distributed among its shareholders. For beginning investors, understanding dividends is a key aspect of the investing process. Dividends can provide a stable source of income, especially for those seeking long-term investments.
To profit from dividends, investors purchase shares of companies that regularly pay dividends. It is important to choose companies with a well-established dividend history and a stable financial position. Investors should also consider the dividend yield, which is calculated as the annual dividend divided by the share price.
Investing in dividend stocks can be a strategy for generating passive income and increasing capital. Reinvesting received dividends allows for compound interest, which contributes to the growth of an investment portfolio. It is important to analyze companies and their financial statements to make informed decisions.
Therefore, dividends can be an important tool for beginning investors seeking to increase their income and diversify their investments.
Information about the dividend policy is available on the company's official website in the investor section. This section provides information on how often and how much a company pays dividends. Some companies set a minimum dividend amount, while others may not. For example, some companies distribute 50% of net income to shareholders, while others distribute 25% of free cash flow. This is important to consider when choosing stocks to invest in, as dividends can significantly impact overall investment returns.
Investment services provide information on previous dividend payments, including the frequency of payments and the level of the company's dividend yield. This allows investors to assess the stability and attractiveness of investment opportunities. Analyzing historical dividend data helps form a more informed opinion about the company's prospects and make informed decisions.
Severstal sets its dividend amount based on the net income and cash flow of both the company and its subsidiaries. With a net debt/EBITDA ratio below 0.5, Severstal is able to pay out more than 100% of its free cash flow in the form of quarterly dividends. This demonstrates the company's financial stability and confidence in its future earnings, making it attractive to investors seeking reliable sources of income.
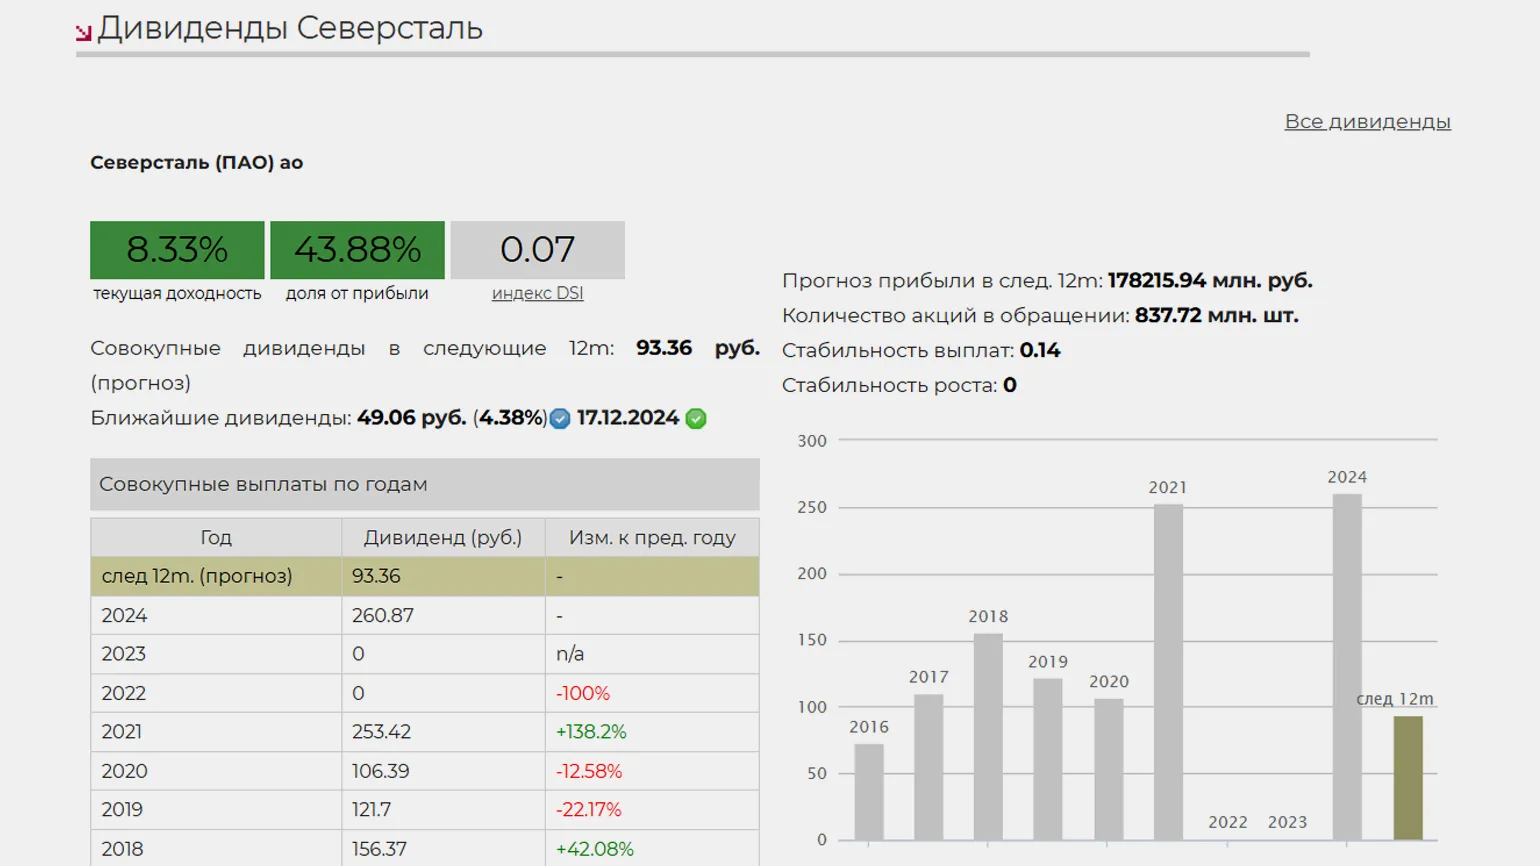
The company did not pay dividends in 2022 and 2023, but resumed this practice in 2024. On October 21, 2024, the board of directors recommended paying dividends for the third quarter in the amount of RUB 49.06 per share. This payment will require the company to allocate more than RUB 41 billion, which is almost equal to free cash flow. The return to dividend payments underscores the company's financial stability and its commitment to rewarding shareholders.
The total dividend for 2024 is RUB 309.93. This figure reflects the total amount of dividend payments that shareholders can expect during the year. Dividends are an important aspect of investing, as they provide income to shareholders and can serve as an indicator of a company's financial health. An increase in dividends may indicate profit growth and business stability, which makes shares more attractive to investors.
- June 17, 2024 — 38.3 rubles per share;
- June 17, 2024 — 191.51 rubles per share;
- September 9, 2024 — 31.06 rubles per share;
- December 16, 2024 — 49.06 rubles per share.
What multiples to evaluate
Multipliers are key financial indicators used to assess the investment attractiveness of a business. There are many different multiples, among which the most effective for analysis are:
- P/E. Shows how investors value the company in the industry. It is calculated as the ratio of market capitalization to net income. If the P/E value of a Russian company is in the range from 0 to 5, this may indicate that the company is undervalued. If this figure is above 5, then the company is probably overvalued. If P/E is less than 0, the company has incurred losses.
- P/S. This is the ratio of the company's market capitalization to its revenue, or the ratio of the market price of a share to the revenue per share. A multiple value below 2 is considered normal. If P/S is less than 1, the company can be considered undervalued.
- P/BV. This is the ratio of the share price to its book value. A P/BV value below 1 indicates that for every ruble of the company's market capitalization, there is more than a ruble of assets: that is, the business has reserves to pay shareholders money in the event of bankruptcy. If the value is greater than 1, for every ruble of market value of a share there is less than a ruble of real value: if the company has to return money to shareholders, there may not be enough funds.
- EV/EBITDA. This is the company's value relative to EBITDA. The lower the indicator, the better. But if the value is negative, it usually indicates a loss.
- EBITDA margin. The multiple allows you to estimate what share of total income is the company's profit before taxes, interest payments, and depreciation. The higher the indicator value, the more efficiently the company operates.
- ROE. Shows how effectively a company uses its equity to generate profit. To find the indicator, you need to divide the net profit by the equity and multiply by 100%. A high ROE is considered a positive indicator.
- Debt/EBITDA. It shows how many years the company will need to pay off all debts if it continues to generate profit at the current level. Typically, the value of this ratio is 1-2. If it is greater than 2, it indicates a high level of debt for the company. A value below 1 may indicate that the business is not using all possible means to raise additional financing and, as a result, is producing fewer goods or services than it could.
- EV. It shows the fair value of the company. To calculate EV, you need to add all debt obligations to the market capitalization and subtract the amount of available cash from the result.
It is not necessary to calculate the multiples yourself, as they can easily be found on analytical platforms, in brokerage applications, and specialized resources for investors. However, calculating multiples is also possible using the company's financial statements. For example, P/E and P/S multiples can be calculated based on the income statement, while calculating EV/EBITDA requires information from the balance sheet. This allows investors to better understand the company's financial health and make more informed investment decisions.
Comparing a company's multiples with those of its competitors allows one to evaluate business performance. However, this approach has its limitations. Comparing multiples alone fails to account for a company's unique characteristics and potential cash flows. Therefore, for a more in-depth analysis, investors often assign a specific weight to each multiple. This allows for more accurate assessments and informed investment decisions.
If you are analyzing securities for the first time, pay attention to the multiples and their changes over the past few years. It is also important to complete all the other steps described in this guide to gain a full understanding of the analysis process.
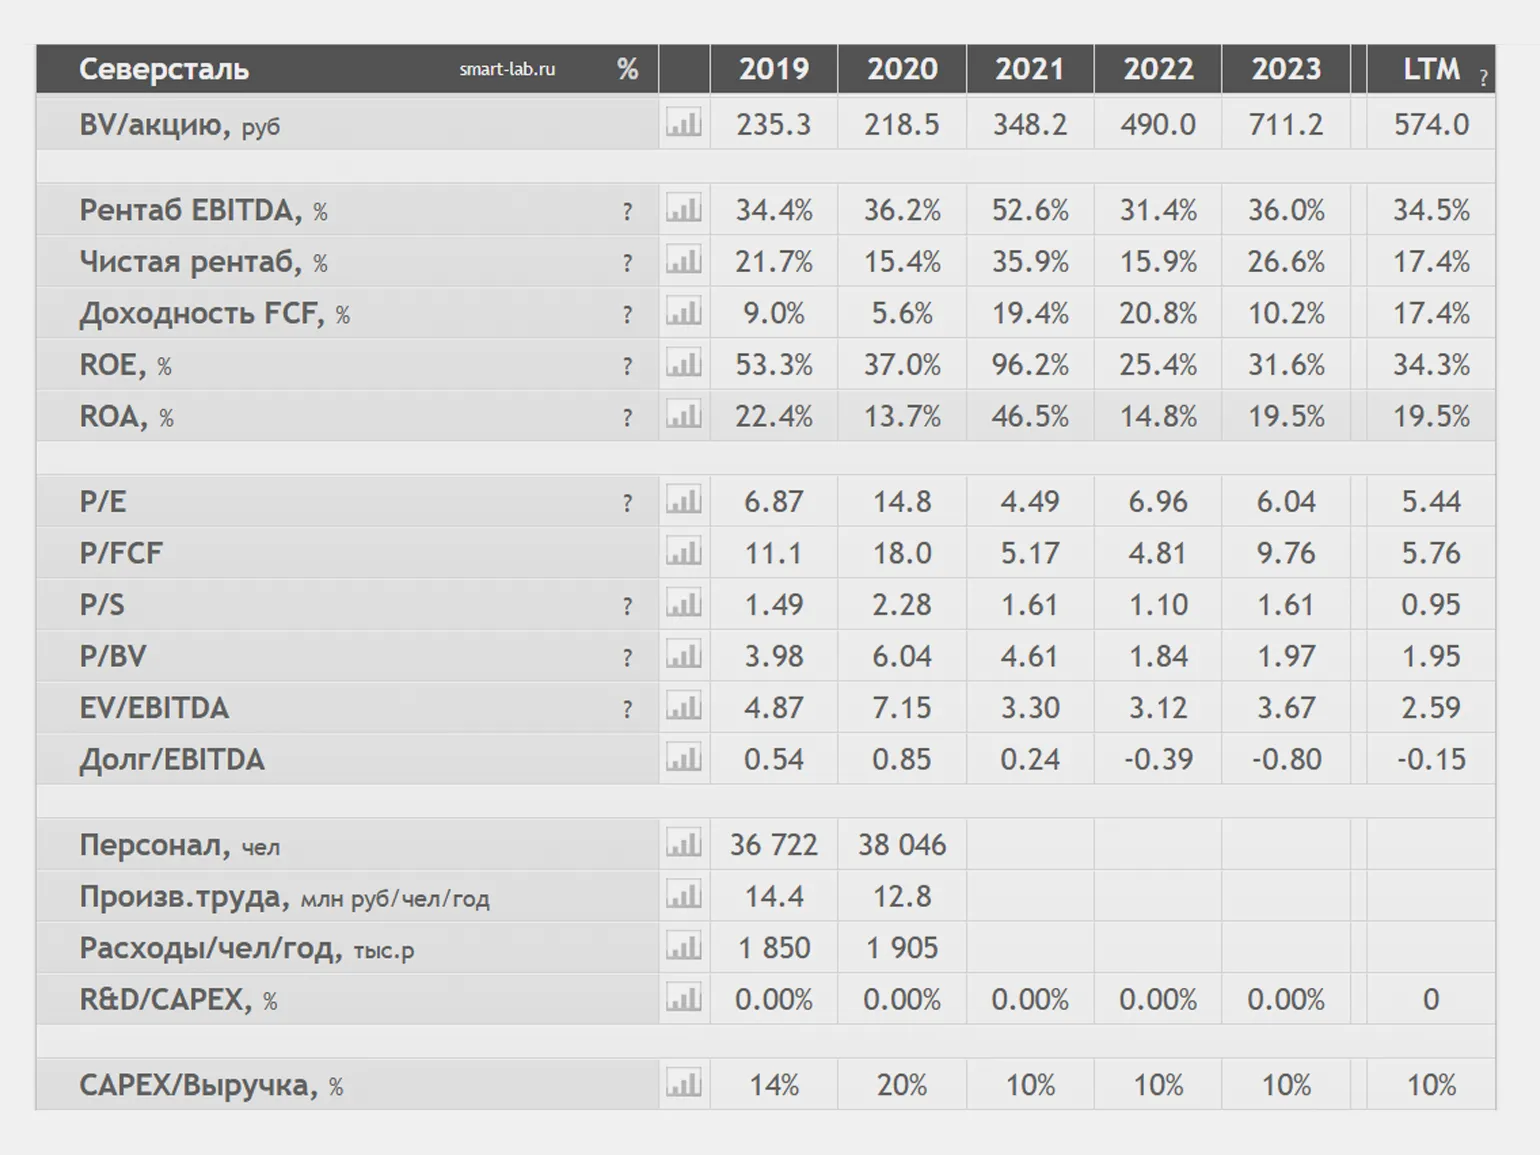
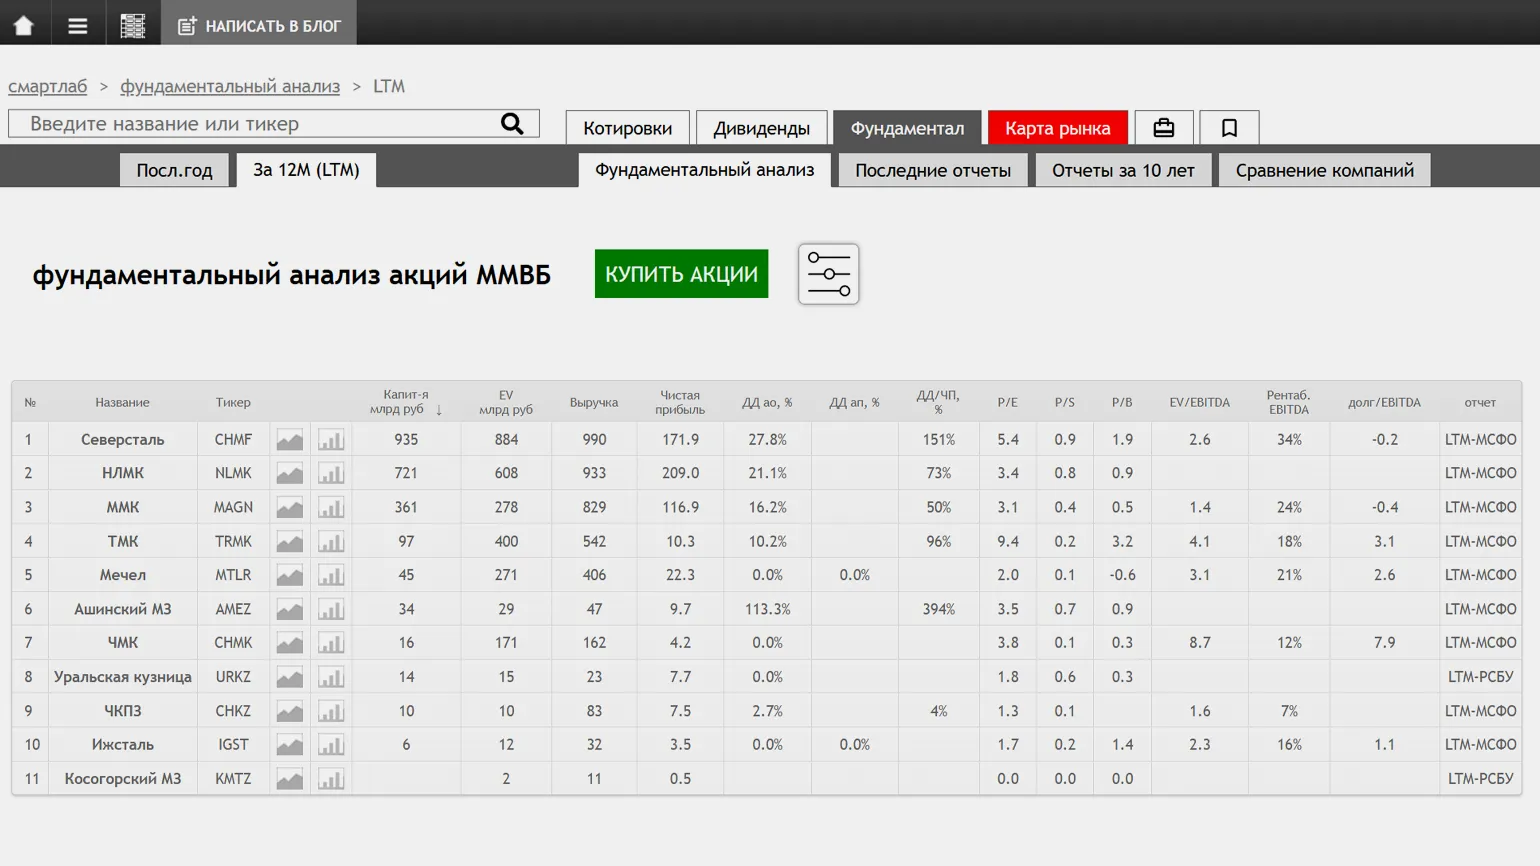
Severstal has a market capitalization of 891 billion rubles, and the market value of one share is 1,070 rubles. The fair value of the shares, calculated based on the EV indicator, is 1,038 rubles. The company's key financial ratios include EV/EBITDA of 2.45, P/E of 5.17, P/S of 0.9, and P/BV of 1.85. The Debt/EBITDA ratio is -0.15, indicating a low debt burden, and the EBITDA margin is 34.5%. The company's ROE is 34.3%. An analysis of these metrics over the past several years shows that Severstal is valued below its historical average in 2024, which may be of interest to investors seeking investment opportunities.
Analyzing the company's multiples relative to key industry peers such as MMK and NLMK allows for an assessment of financial performance and competitiveness. Multiples such as P/E, P/B, and EV/EBITDA provide insight into a company's value relative to its profitability, assets, and operating performance. Comparing these metrics with peers helps identify a company's strengths and weaknesses, as well as determine its market position. Understanding multiples is key for investors and analysts seeking to make informed decisions based on a company's financial health and growth prospects.
Severstal shares are valued higher than MMK and NLMK shares. This is due to Severstal's profitability exceeding the financial performance of its main peers. As a result, investors view Severstal shares as more attractive, which may indicate the company's stability and effectiveness in the metals industry.
To analyze Severstal shares, it is important to compare them with the shares of companies such as Mechel, TMK, Izhstal, and other players in the sector. Comparison data can be obtained from specialized analytics services. The results show that Severstal demonstrates competitive performance, not inferior to its competitors in the industry.
How to Analyze a Company's Prospects and Risks
To analyze a company's development prospects and identify potential risks, it is necessary to assess the market and the general state of the economy. Universal recommendations in this matter are difficult to formulate, as they depend on the specifics of a particular business. It is important to consider industry trends, the competitive environment, and macroeconomic factors that may affect the company's results. A thorough analysis of these aspects will help better understand the current situation and develop a strategy for successful development.
One of the key indicators of economic growth is the gross domestic product (GDP). In addition, the labor market and the PMI index, which reflects the level of business activity, are important indicators of the state of the economy. An index value below 50 signals a possible economic downturn. If in such a situation there is an increase in unemployment and a decrease in GDP, this may indicate a weakening economy, which, in turn, negatively affects the shares of the company being analyzed. To better understand these relationships, it is useful to look at specific examples.
In June 2024, Severstal presented its new development strategy, running through 2028. This strategy expects EBITDA to grow by 10% annually over the next five years. The company also aims to increase its domestic market share from 15% to 20%. A key achievement was the early completion of the overhaul of blast furnace No. 5, which will increase production capacity and improve the plant's efficiency.
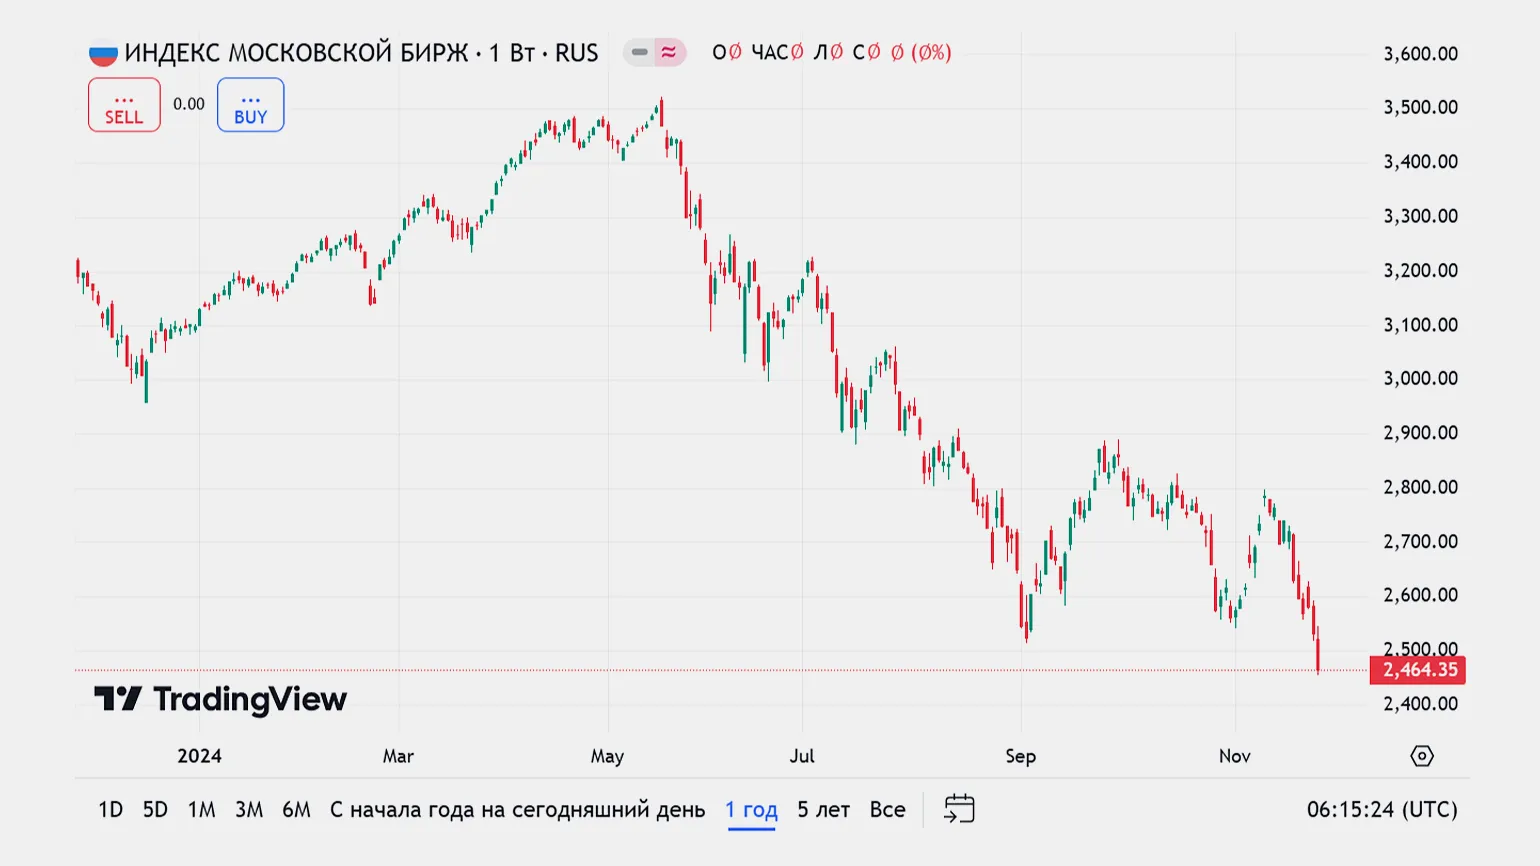
What are the risks in the financial market? Let's start with the general dynamics: the Moscow Exchange index exceeded 3,500 points at the beginning of the year, but by the beginning of December it had fallen below 2,600 points. There is a possibility that its value will fall below 2,500 points by the end of the year. In addition, at the upcoming meeting of the Central Bank of Russia on December 20, an increase in the key interest rate is possible, which will negatively impact stocks. These factors could cause further market volatility and put pressure on investors.
When analyzing the situation in the company There are several key points to consider in the market. First, it's important to pay attention to current trends and changes in consumer preferences. This will help you understand which products or services are becoming more popular. Second, it's worth assessing the competitive environment: the strengths and weaknesses of the main market players, as well as their strategies. The third aspect is the company's financial condition, which can have a significant impact on its ability to adapt to change. Finally, it's necessary to consider macroeconomic factors, such as inflation, interest rates, and overall economic stability, which affect the market as a whole. These aspects will help you more accurately formulate your company's development strategy in an environment of constant change.
- There is geopolitical instability. December could be a difficult month due to the weakening of the ruble and sanctions pressure.
- Capital expenditures at enterprises continue to grow. For example, Severstal expects that expenditures in 2025 will amount to 170 billion rubles - this is 100 billion more than in 2025. Due to rising costs, margins are decreasing, and businesses need more investment.
- Steel prices are falling, which is negatively impacting revenue.
- Preferential mortgages have been cancelled, and the construction market is shrinking. The construction sector is the largest consumer of metal products, so demand for them may decrease.
- Taxes are rising: for example, from 2025, the mineral extraction tax (MET) will increase from 4.8 to 6.7%, and the profit tax will increase to 25%. Because of this, the company's profits are decreasing, and the volume of investment may decrease.
- There are legal risks: the proceedings with the FAS lasted more than two years. Severstal managed to reduce the fine, but there is a risk of new lawsuits.
- Increased competition is possible. Until January 2025, a duty of 12-24% on galvanized rolled products from China and Ukraine is in effect in Russia. If it is cancelled, the low cost of Chinese steel could affect prices on the Russian market.
- There is a risk of accidents and terrorist attacks - Severstal plants have already been attacked by drones.
Currently, there is a lack of growth drivers for the industry, and companies expect significant costs in 2025. The stock price correction shows that they are 31% below the 2024 high. At the moment, there are no signals indicating a possible increase in the stock price, so most likely, their price will remain at the current level or even decrease. Investing in shares with the hope of quickly selling them at a significantly higher price in the coming months is not advisable.
Why analysis may not help
Even with in-depth fundamental stock analysis, your expectations may not be met. Recent years have demonstrated that some events are impossible to predict, such as the introduction of new sanctions. Forecasts of a key interest rate cut announced in early 2024 proved erroneous. It is important to understand that securities are subject to market conditions, and their value can change unexpectedly. This emphasizes the need to constantly monitor market conditions and adapt investment strategies in accordance with current data.
Currently, many stocks are not optimal for short-term investments. Market prices continue to decline, and investors need to regularly monitor changes and adjust their investment portfolios. In such conditions, it is worth considering alternative financial instruments, such as money market funds, mutual funds, and bonds. These assets demonstrate greater resilience in changing market conditions and can provide more stable income. Investors must effectively adapt to the current situation and choose instruments that help minimize risks.
In the current environment, many stocks have already reached their fair value, and further price fluctuations will be largely determined by the state of the economy. Investors should closely monitor economic indicators, as they can affect stock prices in the future.
The Key to Evaluating a Company's Shares in 5 Points
- Conduct a general analysis of the company: find out what it does, what its development strategy is, what it includes, whether there are any sanctions against it, how cyclical and technologically advanced it is.
- Study the operating and financial statements. Evaluate the volume of production, sales, revenue, net profit, EBITDA, free cash flow, and debt obligations. Ideally, if profit, revenue, free cash flow, and EBITDA are growing steadily.
- Evaluate the dividend policy if the company pays dividends. Find out how much profit the business allocates to payments, how often it pays dividends, and what the dividend yield has been in the past. This will help you understand how much you can earn on payments in the future.
- Evaluate the multiples: P/E, P/S, P/BV, EV/EBITDA, EBITDA margin, ROE, Debt/EBITDA, EV. Compare the indicators with the company's competitors in the industry.
- Analyze the development prospects and risks. For example, evaluate whether product costs are rising, whether taxes will increase, whether there are any legal proceedings involving the company.
How to learn more about investments
- Stocks are not the only investment instrument. Read about mutual funds, bonds, options, and futures to understand how these instruments work and how much you can earn with them.
- If you're just starting out, read the article on investing for beginners and diversification—a must-have for any investor.
- Those who want to learn how to increase their capital may benefit from the Skillbox course "Personal Investing." It teaches fundamental and technical analysis, portfolio construction and management, taxation, and tax benefits. The course was recorded jointly with the Moscow Exchange.
Personal Investments
You will learn how to invest money wisely. Learn how to create an investment portfolio from scratch. You will understand how to make money by investing in securities.
Find out more