
Contents:

Excel and Google Sheets: A Free Course for Everyone
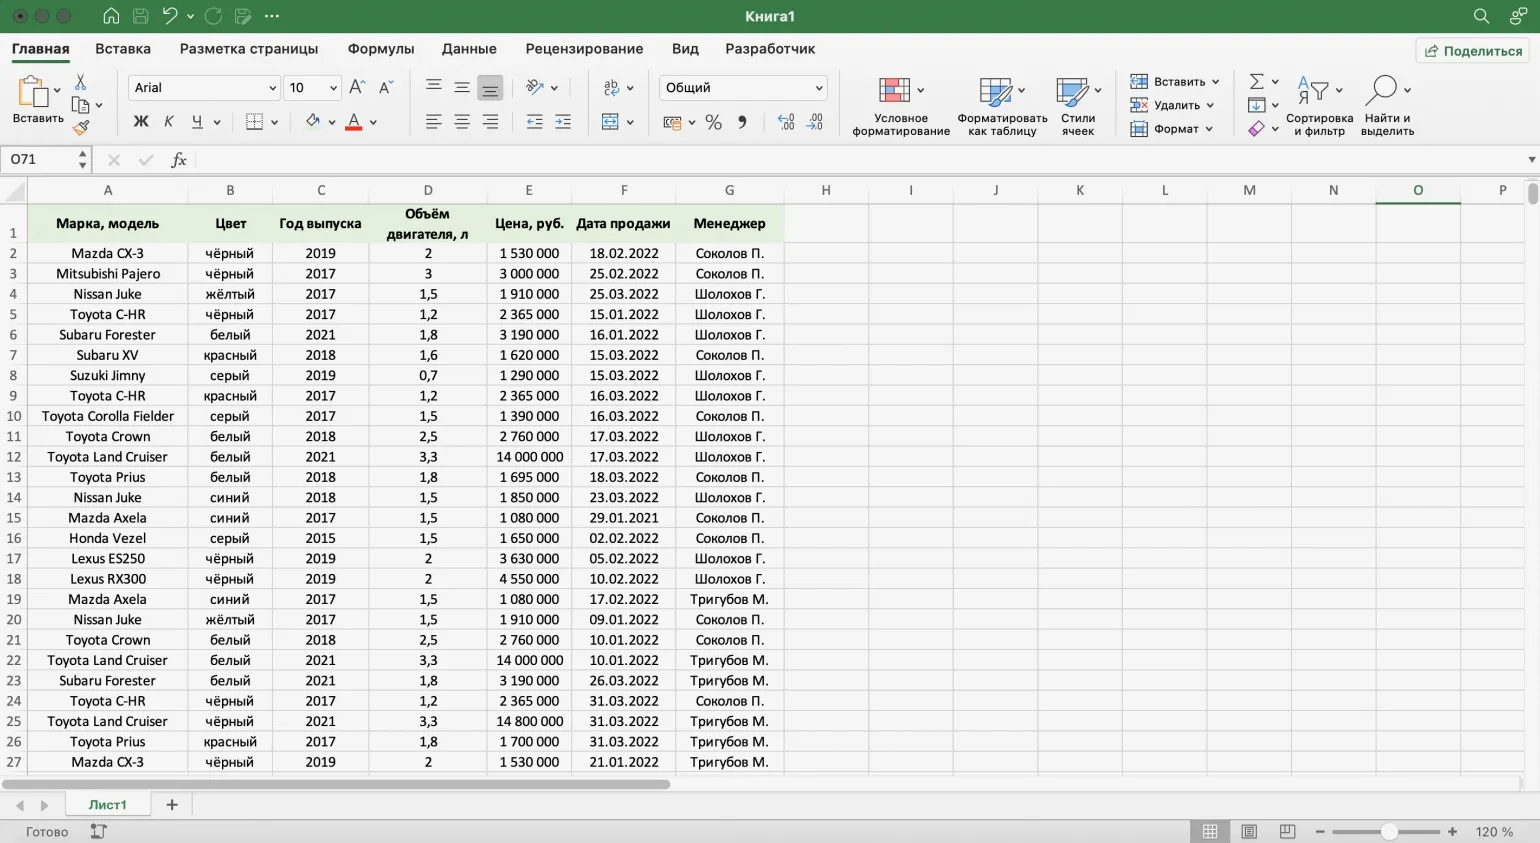
Learn MoreEfficient Data Filtering in Excel: Step-by-Step Data filtering is an important tool that finds wide application in various fields, including e-commerce. Instead of browsing through the entire product range, users can set specific filtering criteria, allowing the system to automatically hide unnecessary items. This significantly simplifies the selection and purchasing process, improving the user experience and increasing the likelihood of completing a purchase. Effective data filtering helps users save time and effort, providing a more targeted approach to finding the desired products. In Excel, filters work on a similar principle. The user sets certain parameters, and the program displays only the data that meets the specified criteria. This significantly facilitates the analysis and processing of large volumes of information, allowing you to quickly find the necessary data and make informed decisions. Using filters in Excel helps streamline the process of working with spreadsheets, making it more efficient and organized. In this article, we will discuss in detail the process of setting up a filter in Excel. Using the example of reporting for a small car dealership, you will see how to effectively work with sales data, including car specifications, prices, transaction dates, and the names of responsible managers. Filters in Excel allow you to quickly sort and analyze information, making them an indispensable tool for processing reports and improving your data management. We will give a visual example that will help you master this functionality and apply it in your practice.
To display only sales made by manager P. Sokolov, we can use the filtering function. This function allows you to select specific data, which significantly simplifies analyzing the manager's performance. Proper data filtering helps you better understand sales performance and identify key performance indicators.
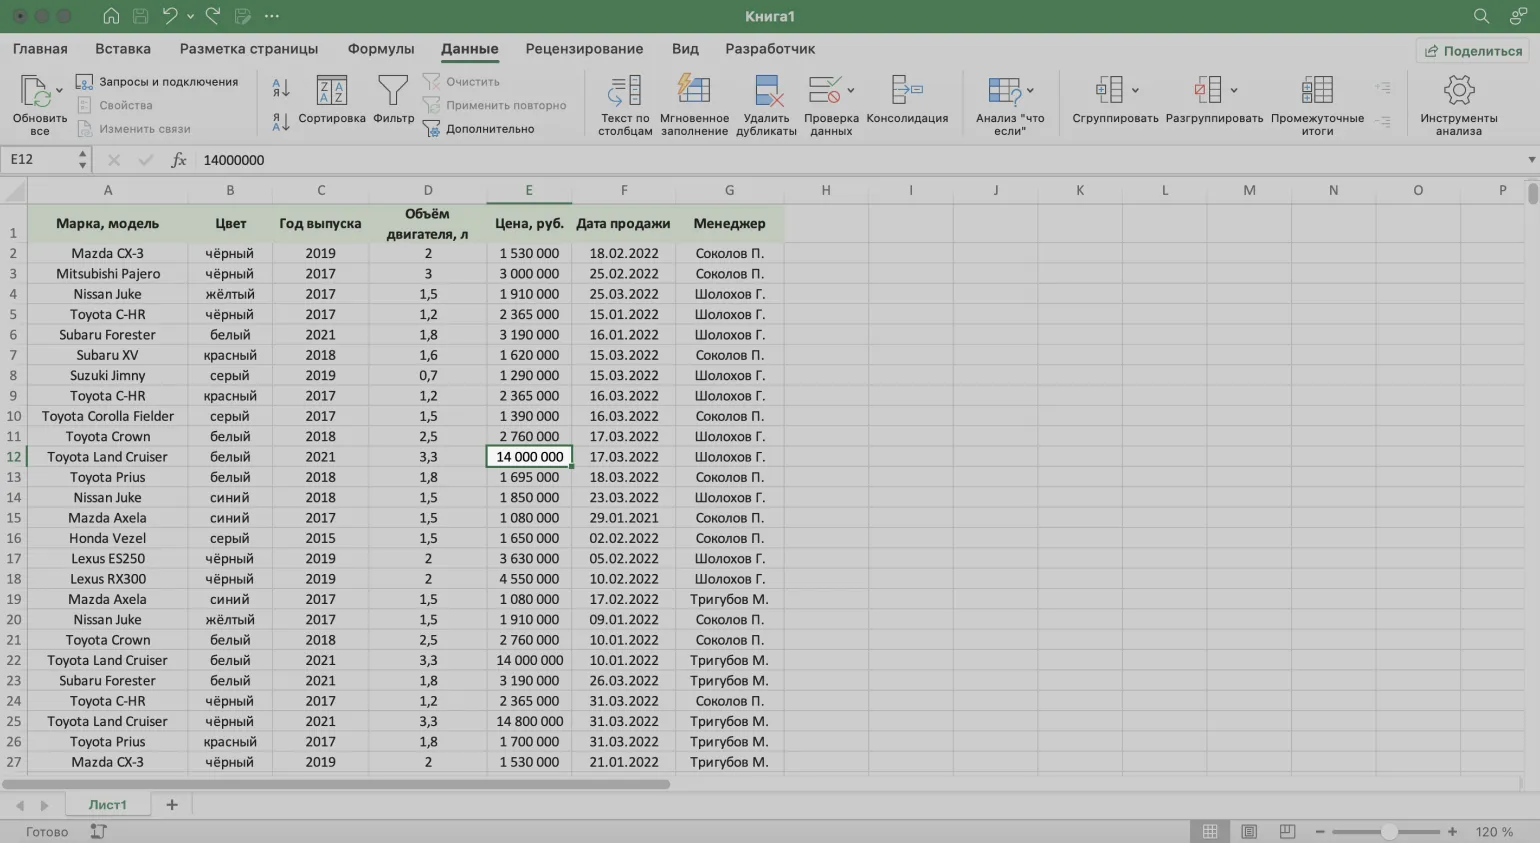
To begin, select any cell in the table. This can be a cell from any column, not necessarily from the "Manager" column.
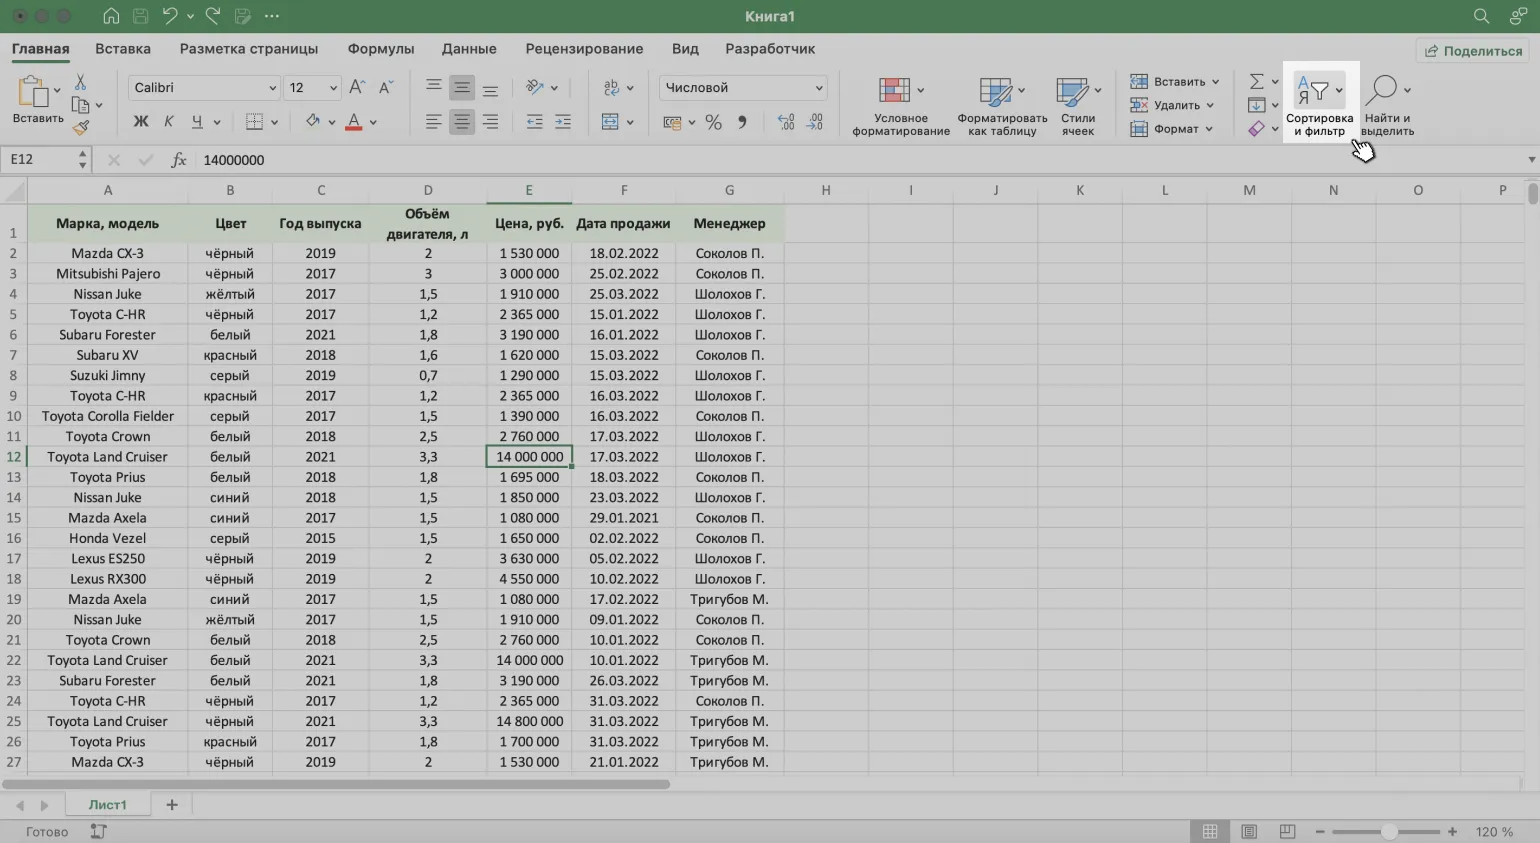
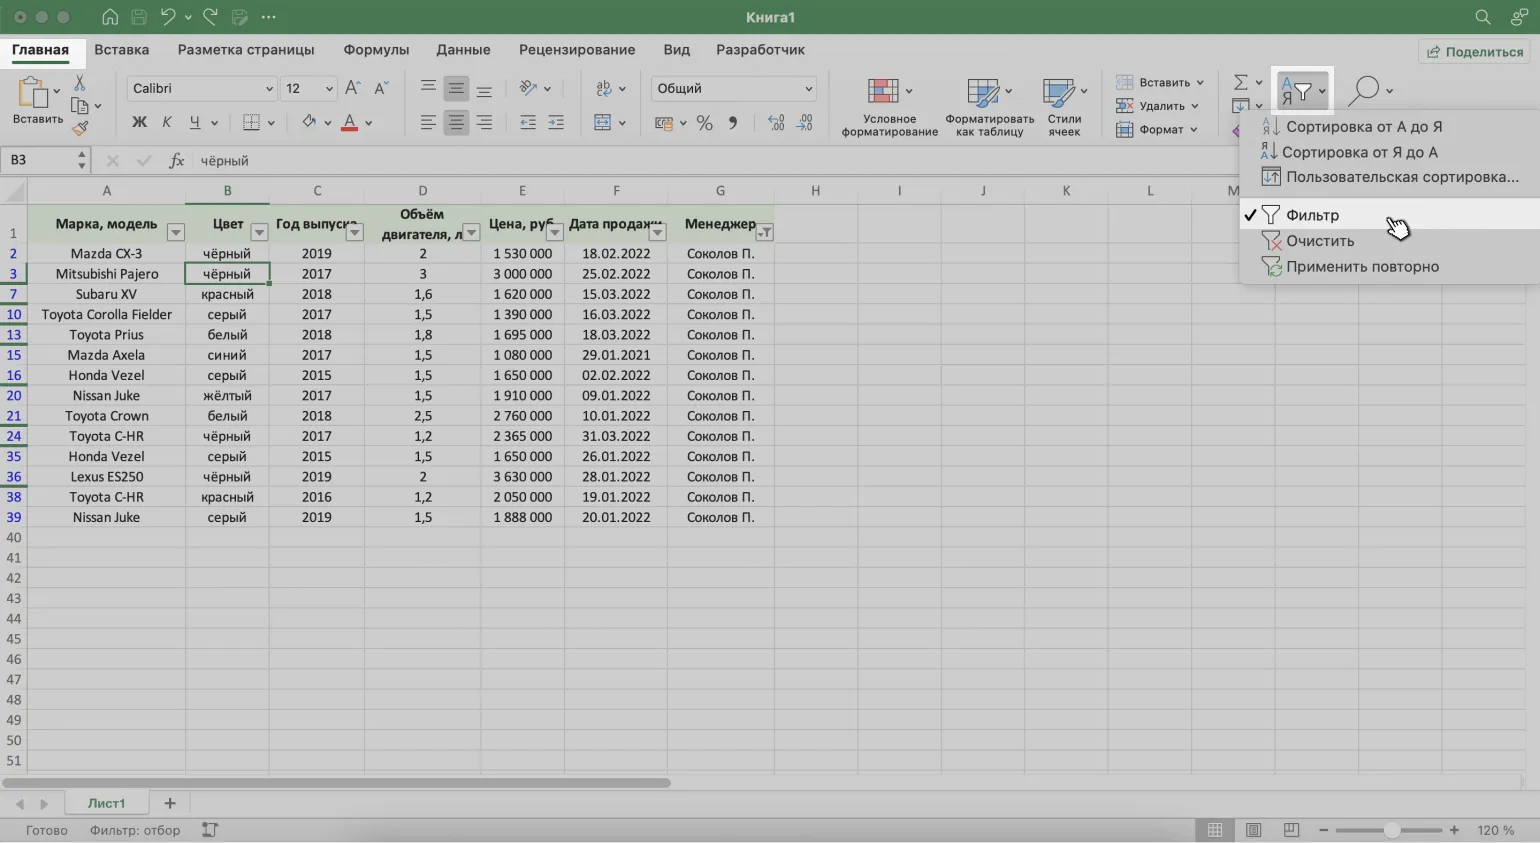
On the Home tab, select the Sort & Filter button to open tools for filtering data. This will allow you to effectively organize and manage information in the table.
Select "Filter" from the drop-down menu. This will enable filtering for all columns in your table, making it easier to work with and read the data. Filtering helps you quickly find the information you need, hide unnecessary entries, and organize data in the format that suits you best.
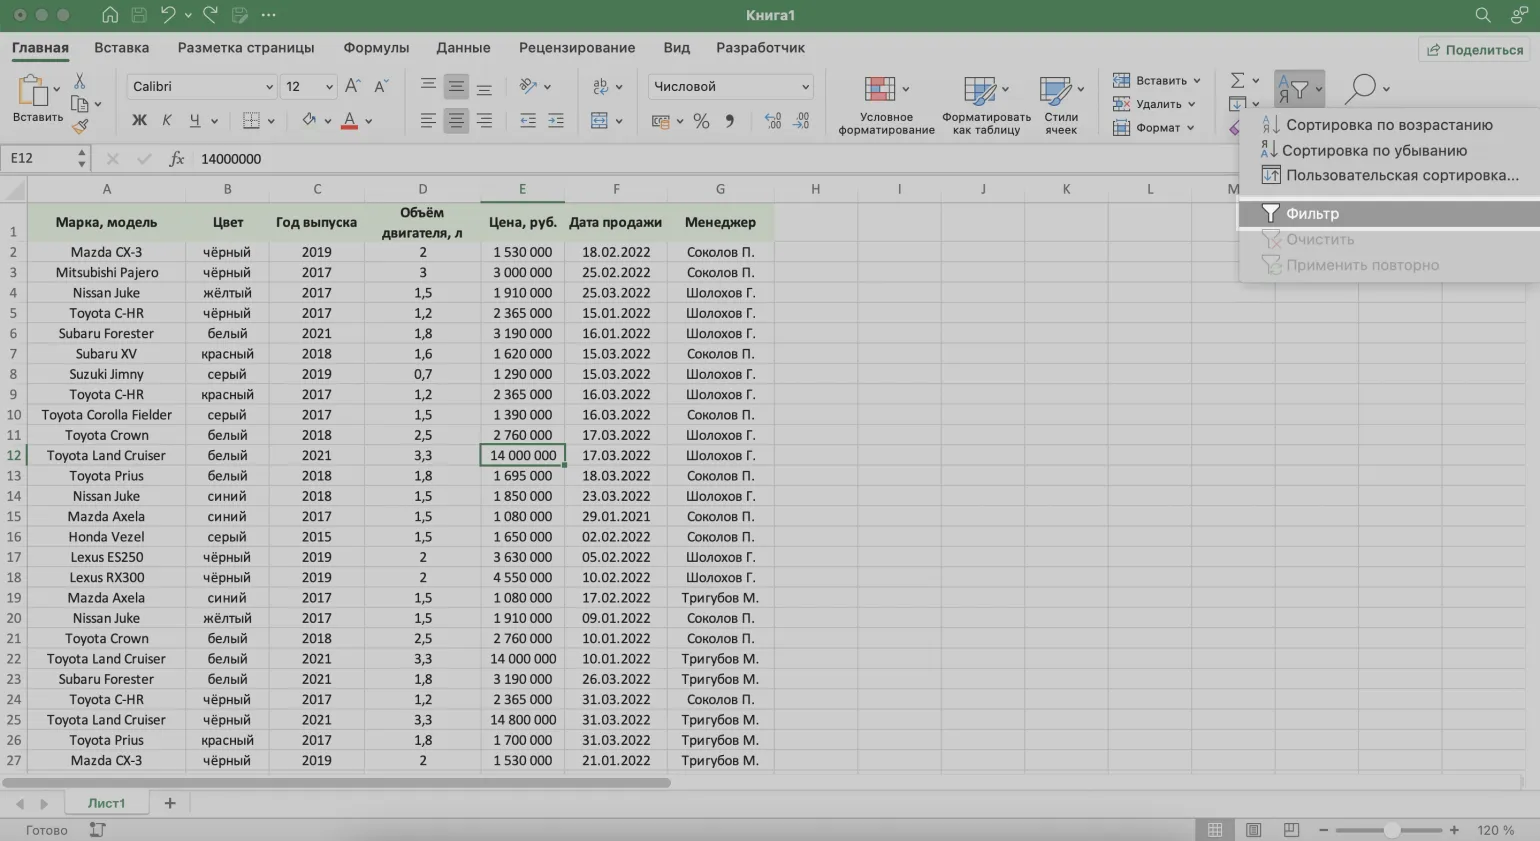
You can also use the "Filter" button on the "Data" tab to achieve a similar result. This will allow you to effectively manage your data and get the results you want without any extra effort. Using filters simplifies the analysis of information and helps to quickly find the necessary data.
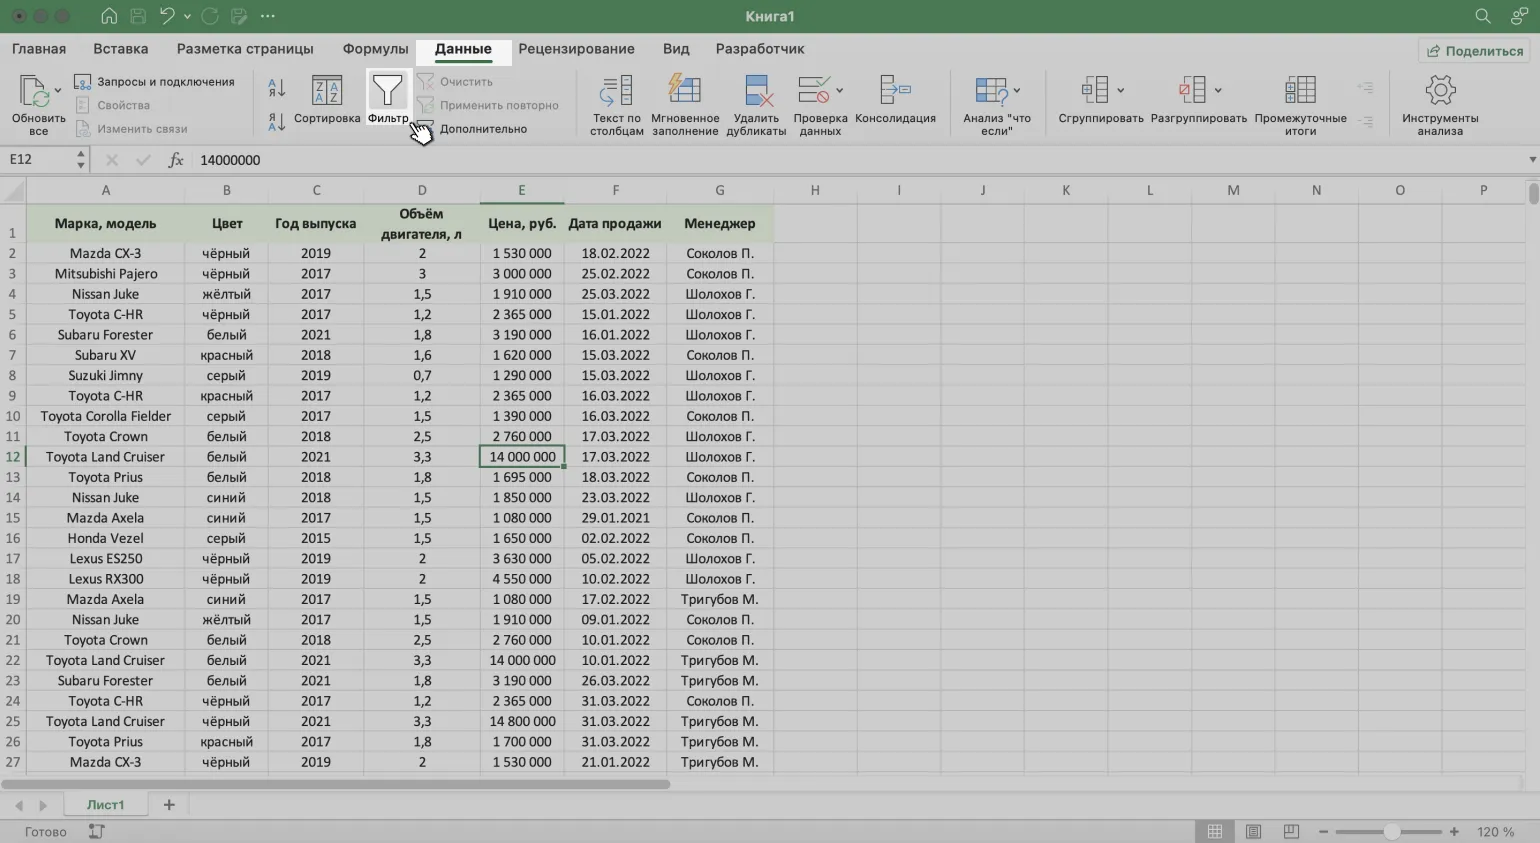
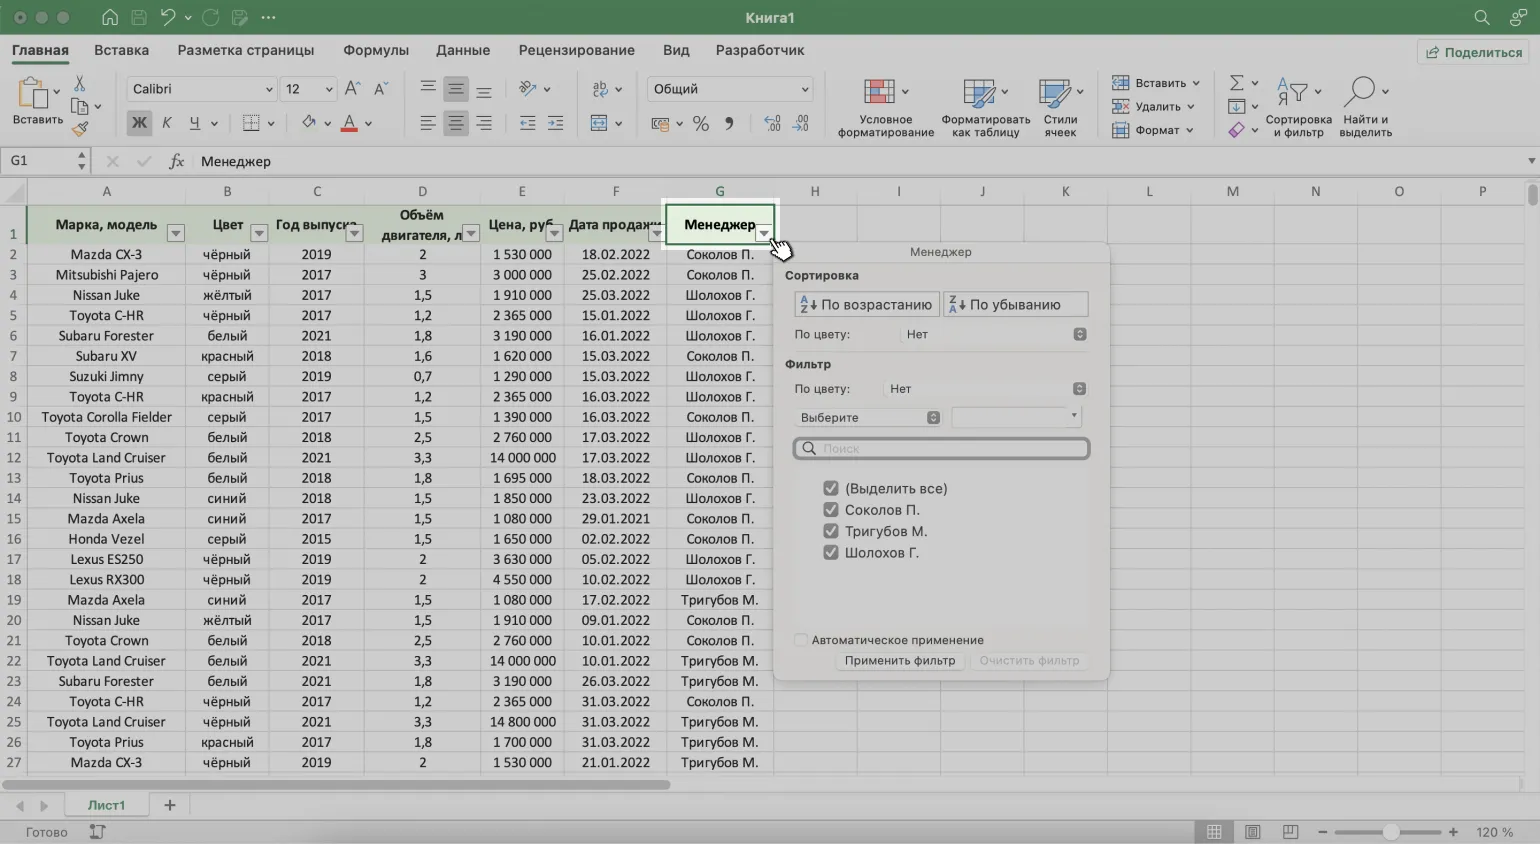
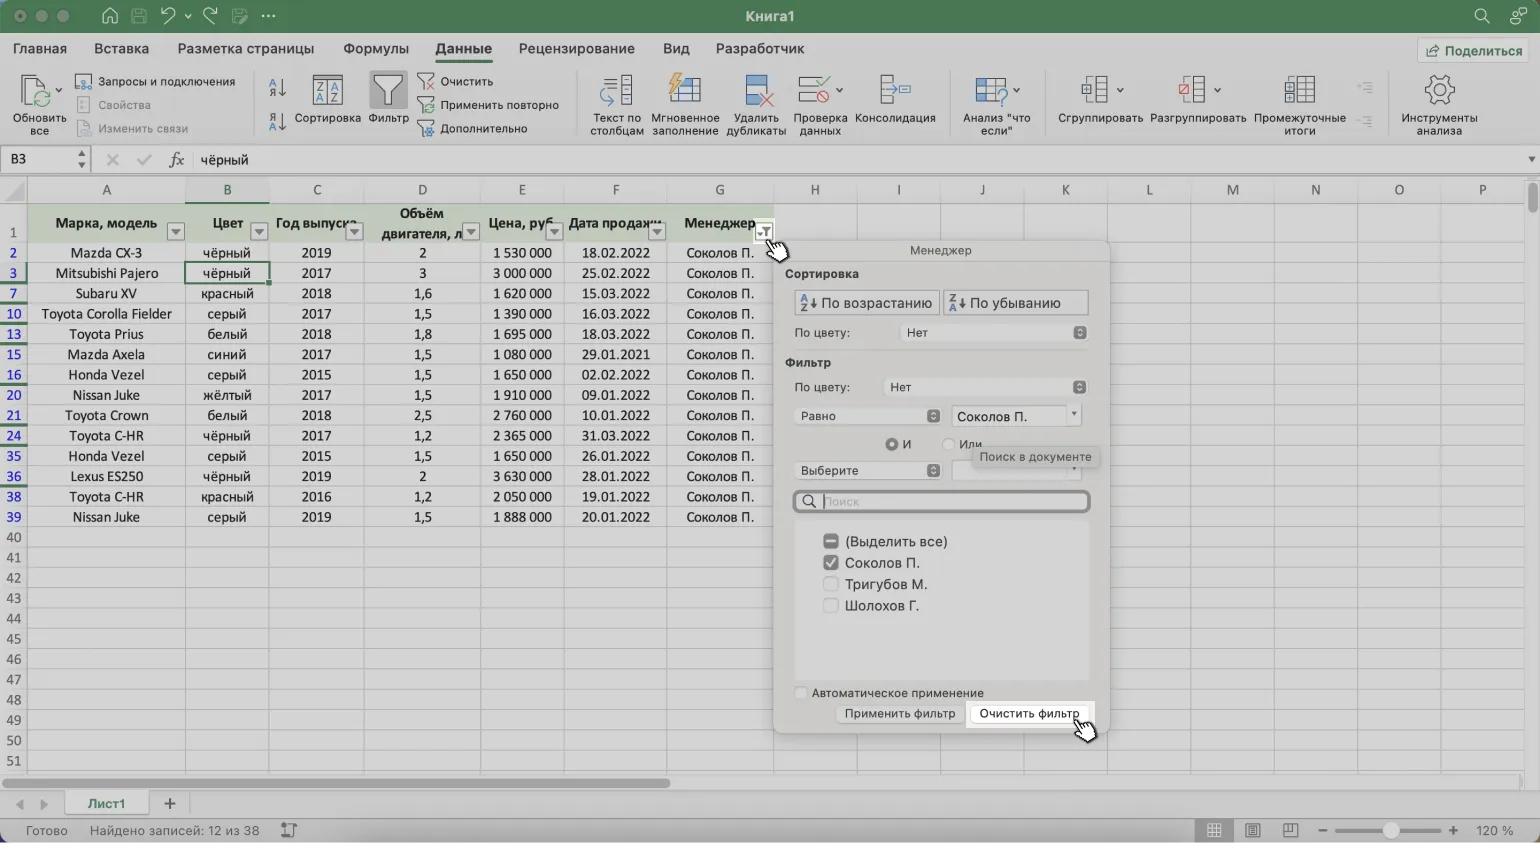
After activating the filtering function, arrow buttons will appear in the table headers. Click the arrow in the "Manager" column header to sort the data by this criterion. This will allow you to quickly find the information you need and make working with the table easier.
Step 4: Defining Data for Visualization
This step requires careful consideration of the data to be displayed. The key goal is to ensure clarity and informativeness of the information presented. Identify the key metrics and indicators that are most meaningful to your audience. Keep in mind that well-chosen data can significantly improve their perception. Use graphs, tables, and other visual elements to present information clearly. It is important that the data is relevant, accurate, and easy to understand. Ensure that each displayed value is clearly related to the overall theme and purpose of your project.
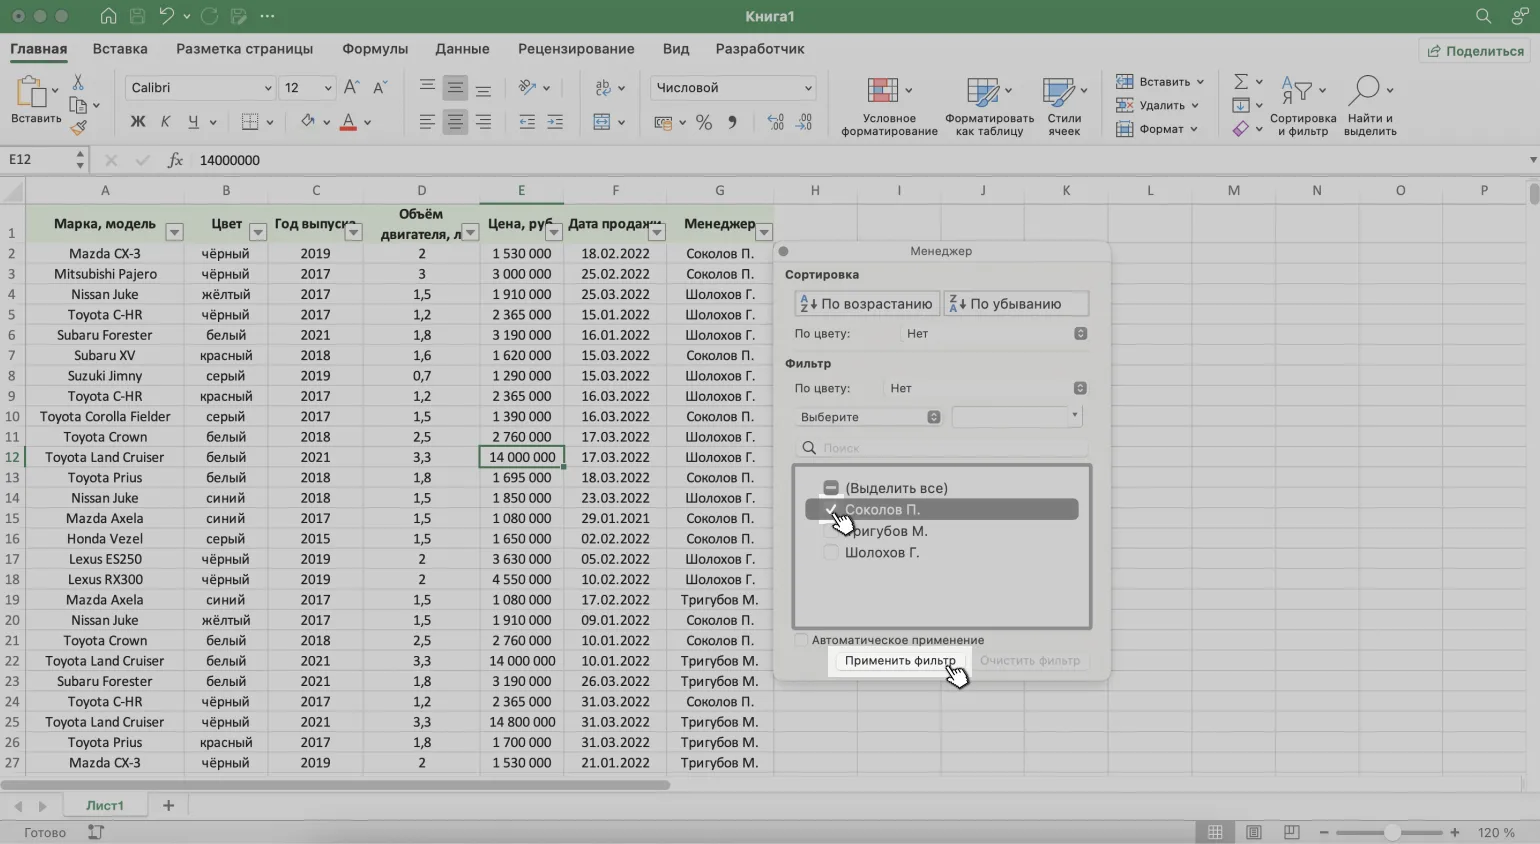
In the menu that opens, use the checkboxes to select the data you want to save in the table. In this case, this is information about the manager Sokolov P. After that, click the "Apply filter" button.
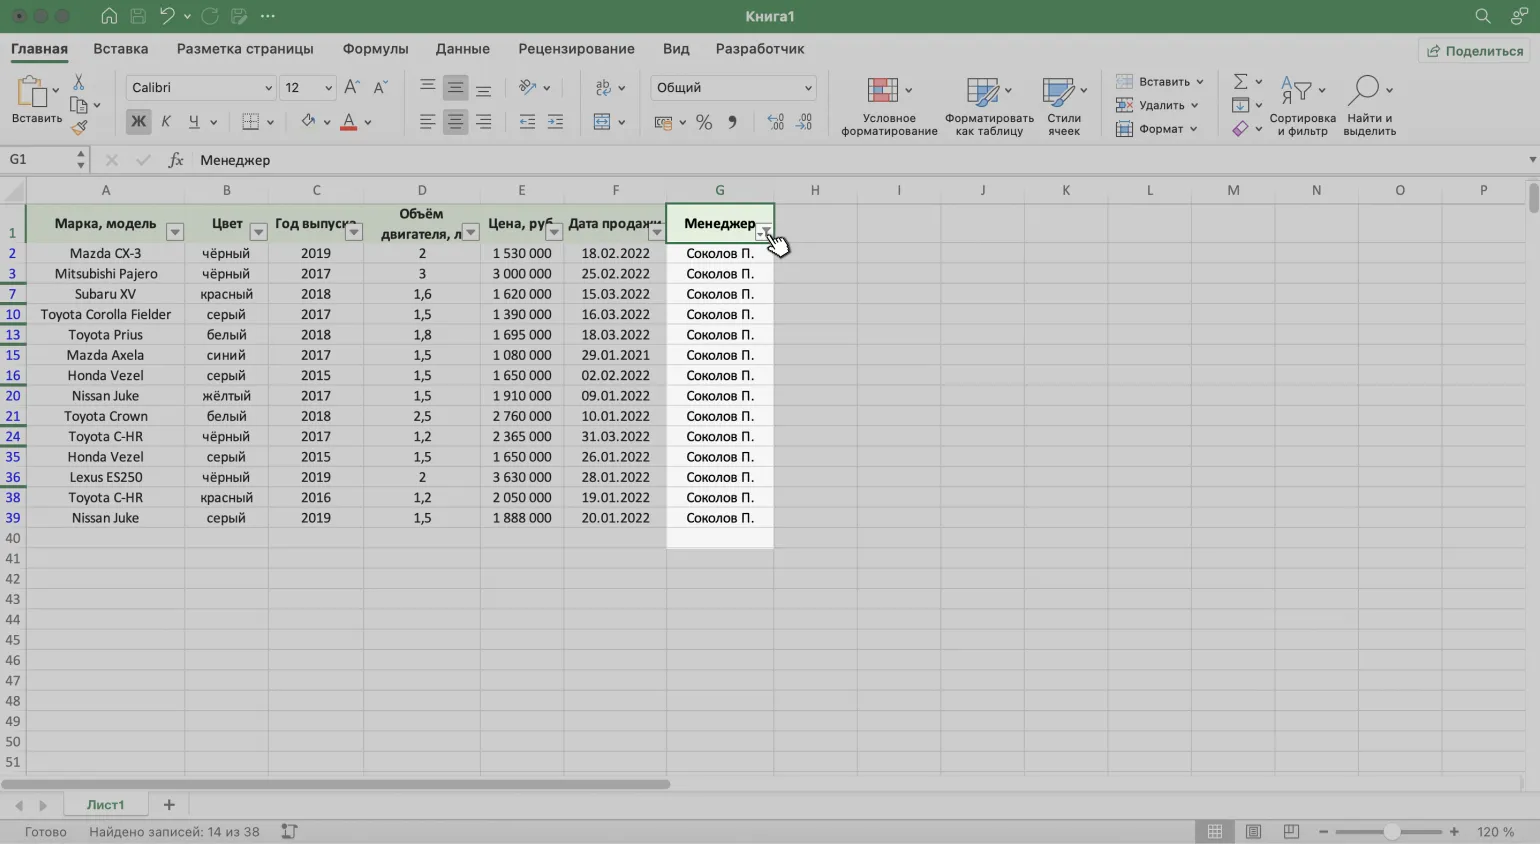
Now the table displays only data on sales made by manager Sokolov P. An additional icon will be displayed on the button with the arrow, indicating the active filtering mode. This will allow users to easily identify that filtering by manager is currently applied, which improves navigation and usability of the table.
Effective Data Filtering in Excel: Setting Multiple Filters
Filtering data in Excel greatly simplifies the process of analyzing information. By applying multiple filters simultaneously, you can display only those records that meet the specified criteria. This is especially effective when working with large volumes of data, as it allows you to quickly find the information you need and simplifies decision-making. Knowing how to effectively use filters in Excel is an essential skill for data analysis and workflow optimization.
Let's look at a practical example that will help you understand how to effectively apply filters. Proper use of filters improves data quality and increases the accuracy of analysis. By applying filters, you can filter out unnecessary information and focus on what is truly important. This is especially relevant in the field of data processing and analytics, where clearly identifying the relevant information is crucial for making informed decisions.
We've already filtered the table, leaving only sales data for manager P. Sokolov. Now let's add a new criterion: display only cars priced over 1.5 million rubles. This will allow us to focus on high-quality cars and analyze their sales in more detail.
Open the filter menu in the "Price, rubles" column by clicking the "Select" parameter. This will allow you to customize product filtering by price range, which will make it easier to find the product you need.
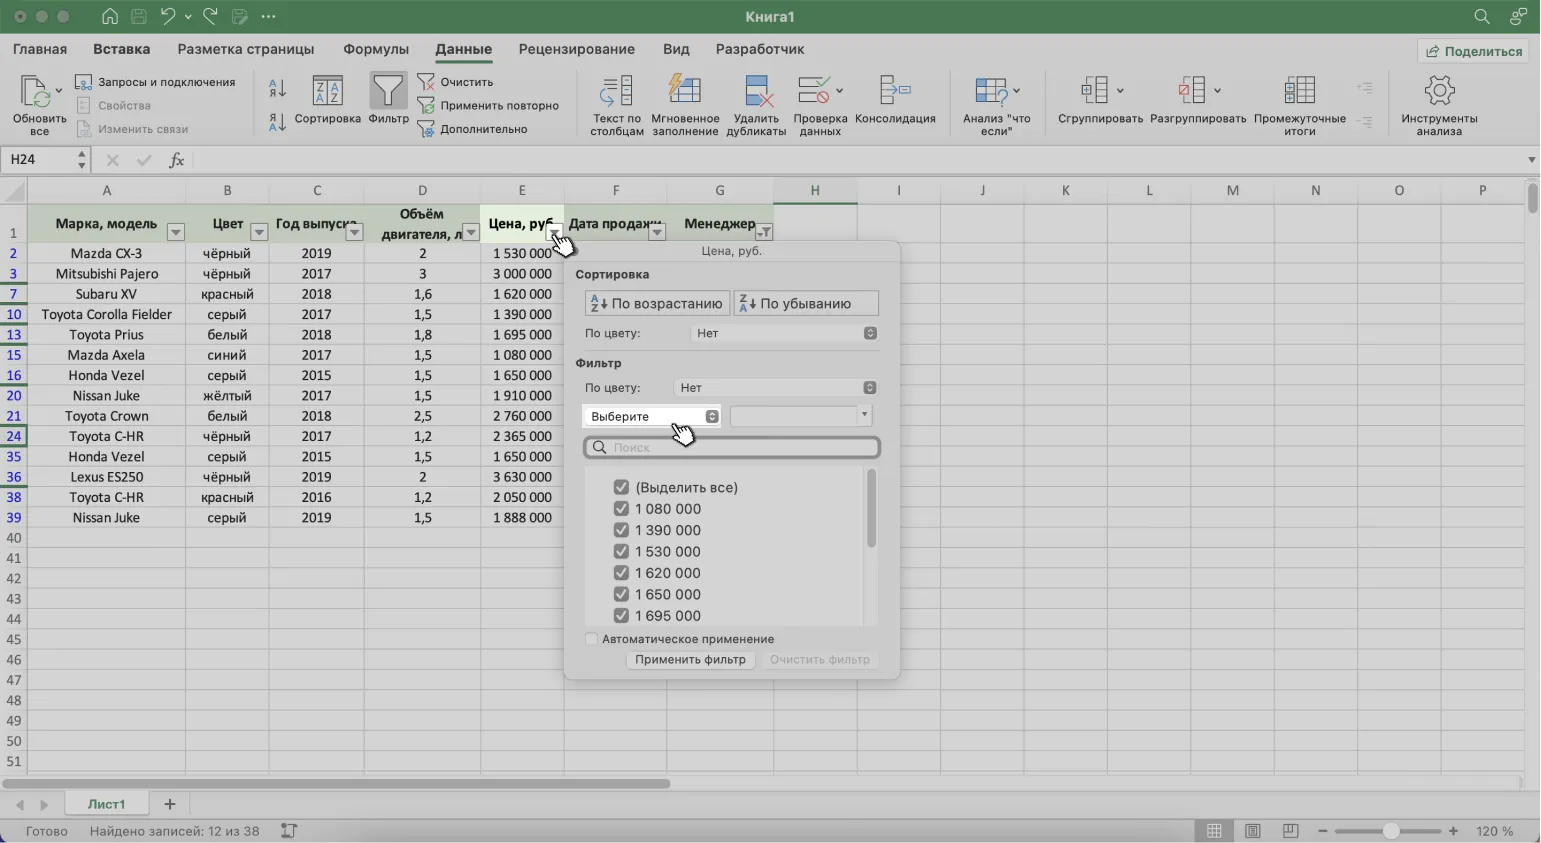
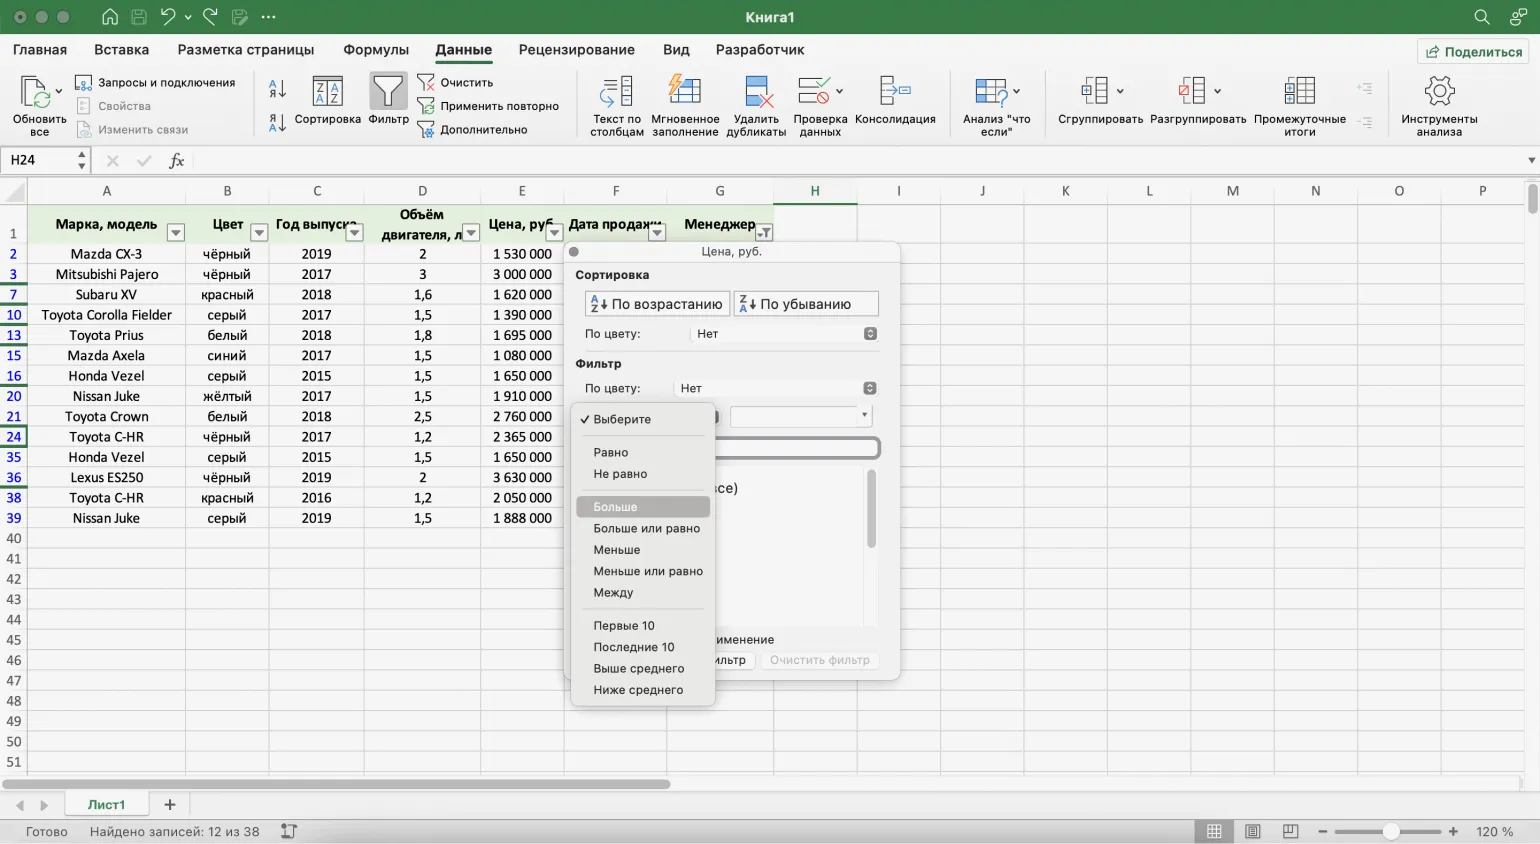
Step 2. Define the filtering criteria for the selected cells.
In this case, we need to display cars priced above 1.5 million rubles. To achieve this, we select the "More" criterion. This will allow users to quickly find cars that match their budget and preferences.
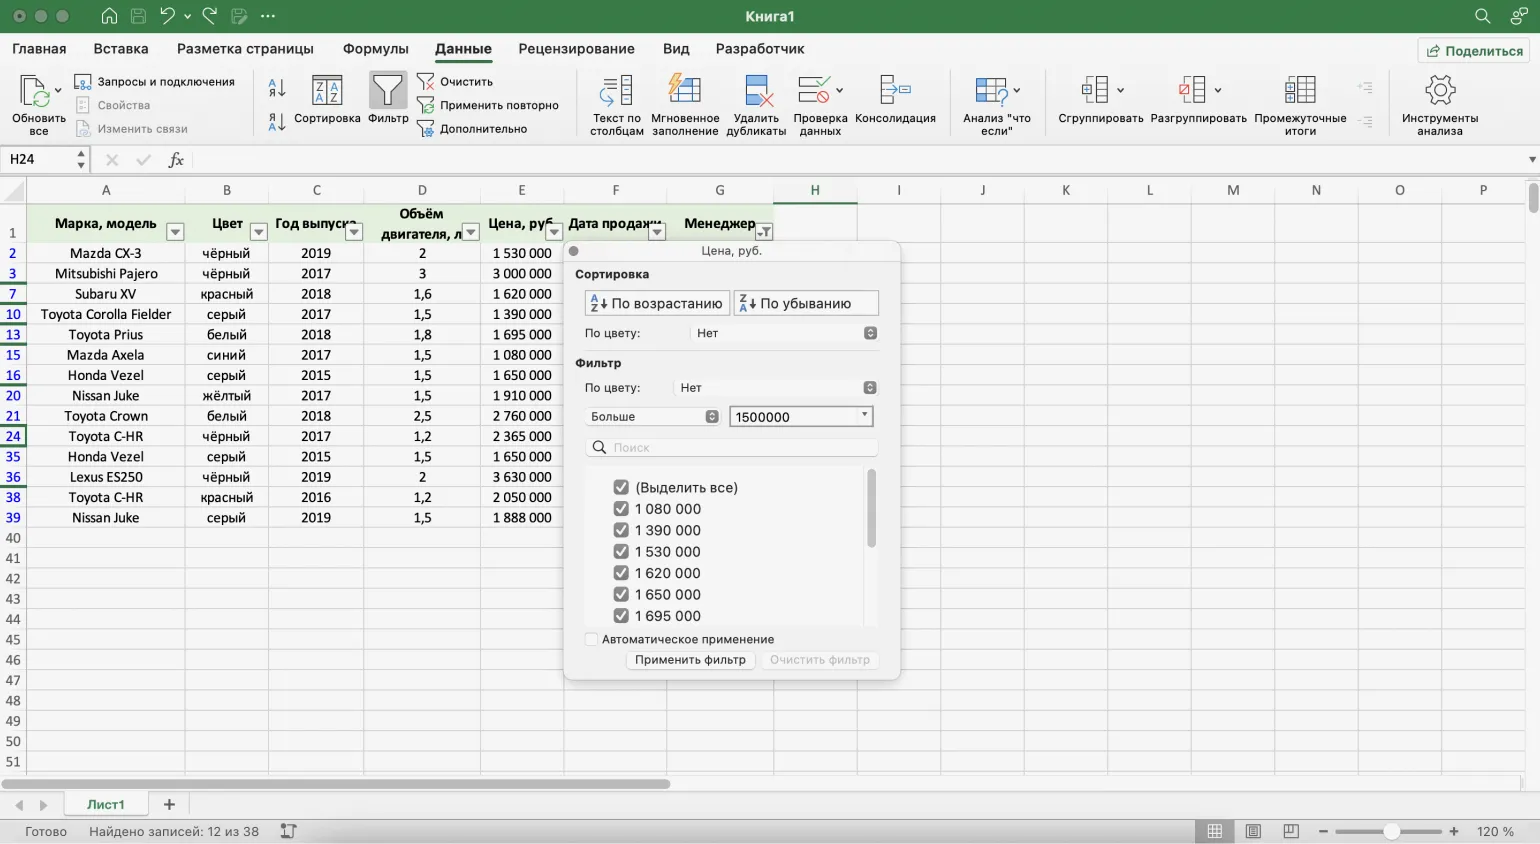
In the third step, we refine the filter parameters. In this case, we set the value to "More than 1,500,000" and click the "Apply Filter" button. This will display only the data that meets the specified criteria, which will greatly simplify the analysis of information.
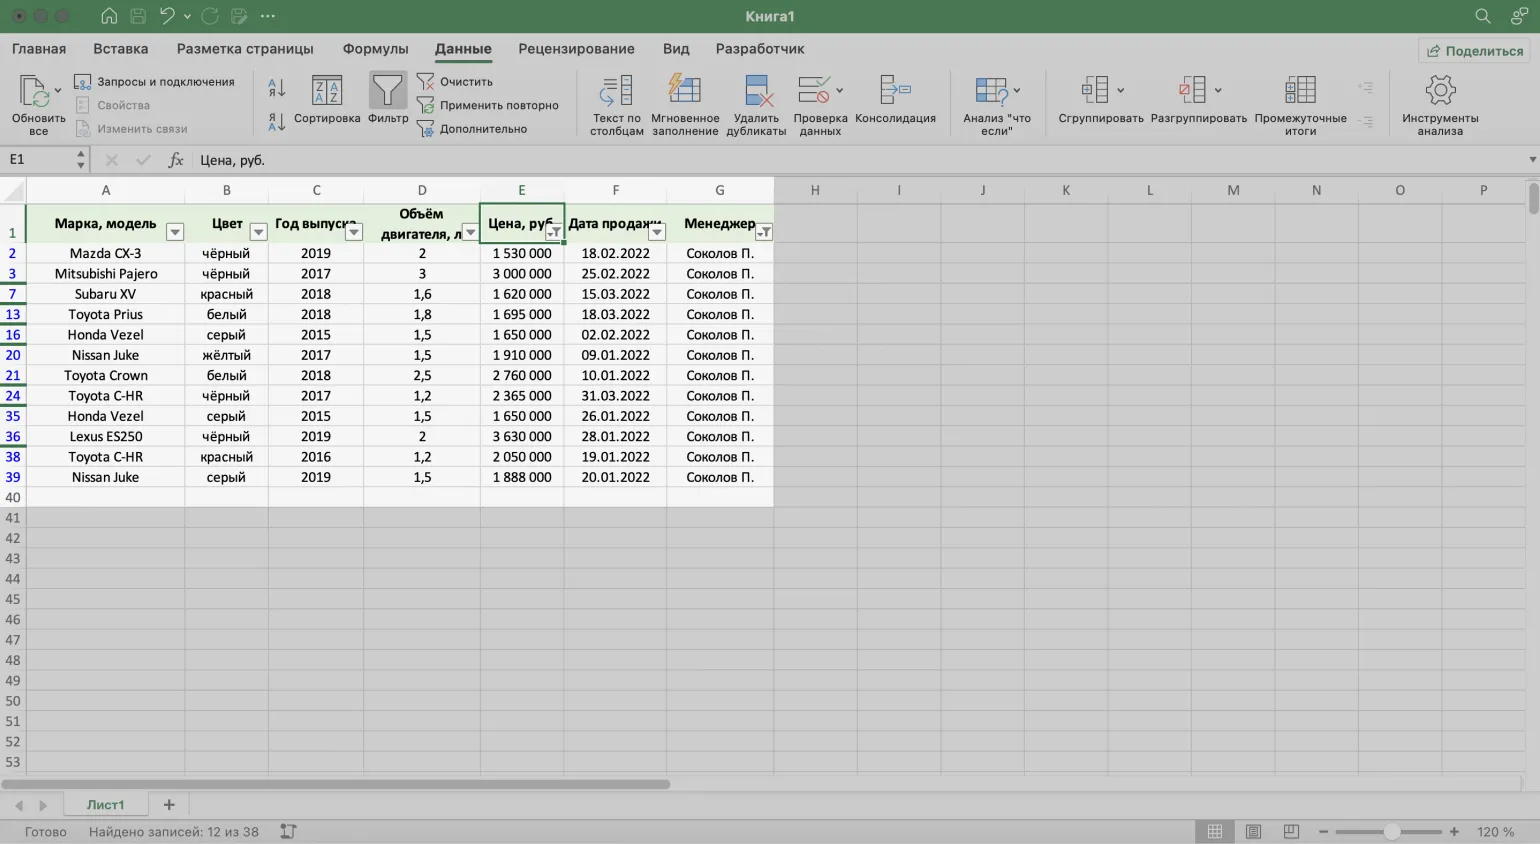
Now the table displays only cars sold by manager Sokol P., priced over 1.5 million rubles. This approach allows us to focus on the highest-quality offers and makes it easier for customers interested in premium cars to find what they're looking for.
Optimizing Data Workflow in Excel: How to Use Advanced Filter
Advanced Filter in Excel is a powerful tool that allows users to effectively filter data by complex criteria across multiple columns simultaneously. This greatly simplifies the analysis of large amounts of information and makes working with data more flexible. Using Advanced Filter helps you quickly find the data you need, eliminating unnecessary information and accelerating the decision-making process. It is important to master this tool to get the most out of Excel for data analysis.
Setting standard filters individually can be a tedious process, especially when dealing with large tables. Using Advanced Filter greatly simplifies this task, saving time and effort. This approach is especially useful for business analysts and data scientists who need to process information quickly and efficiently. Advanced filters allow you to apply multiple conditions simultaneously, making data analysis more flexible and productive.
The advanced filter operates using complex algorithms for processing and sorting data. It allows users to more precisely customize their search parameters, which helps to obtain more relevant results. An advanced filter can include various criteria, such as categories, price ranges, ratings, and other parameters, which significantly simplifies the process of finding the necessary information. Effective use of an advanced filter saves time and effort, improving overall user satisfaction.
- Creating a separate table for filtering conditions, including the header of the original table.
- Entering filtering criteria in a new table.
- Running the filtering process to obtain filtered data.
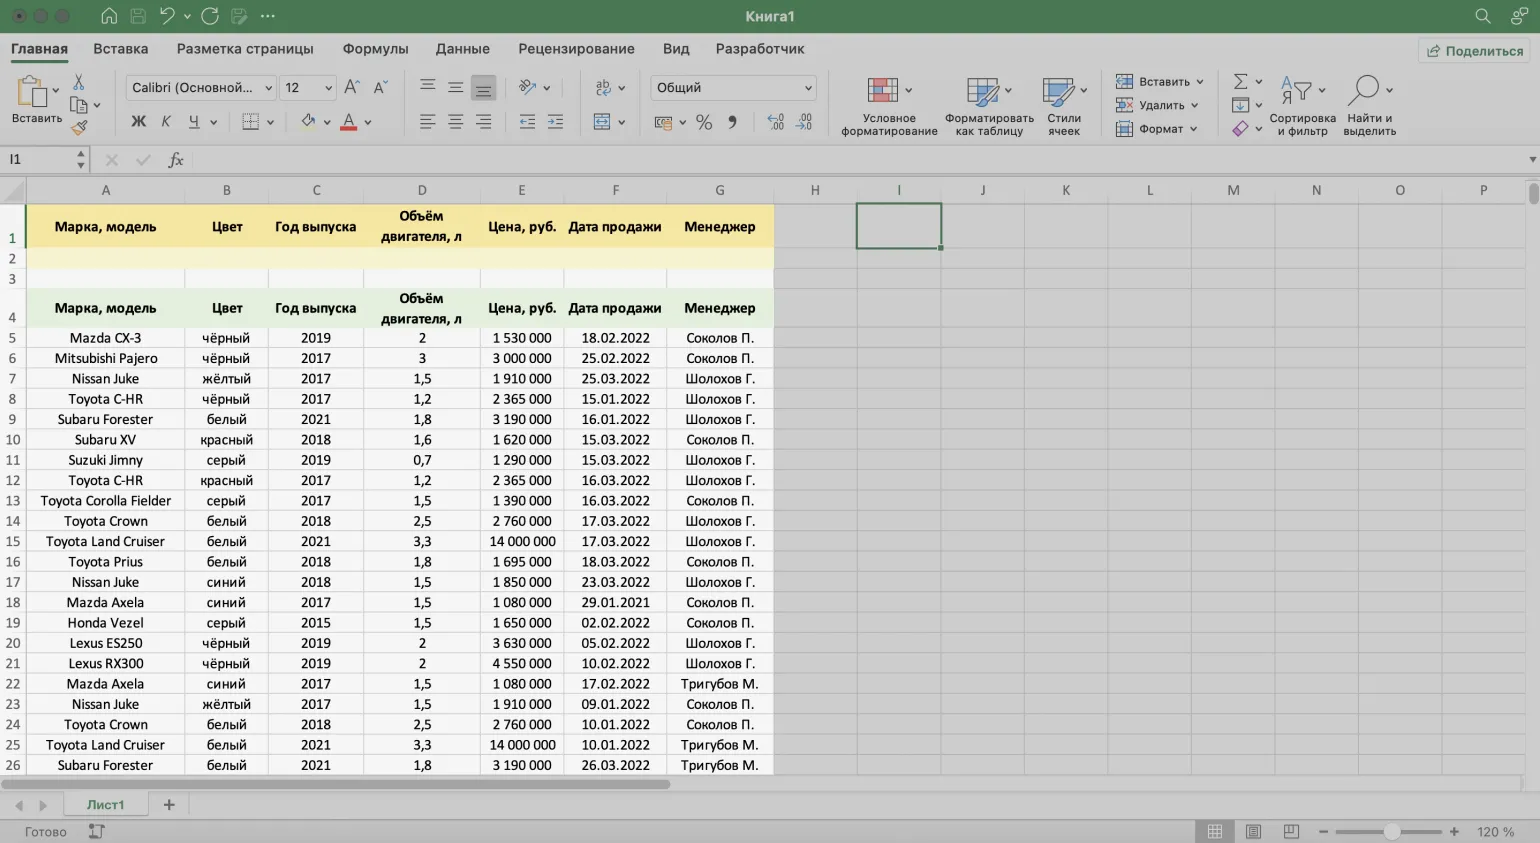
In this article, we will consider an example of filtering car dealership reports by three key criteria. Data filtering allows you to more effectively analyze sales, identify trends, and improve business processes. It is important to consider such parameters as time period, car type, and sales channels. Proper reporting filtering helps car dealerships make informed decisions, optimize inventory, and improve customer service.
- Manager: Sholokhov G.
- Vehicle year: 2019 or earlier.
- Price: up to 2 million rubles.
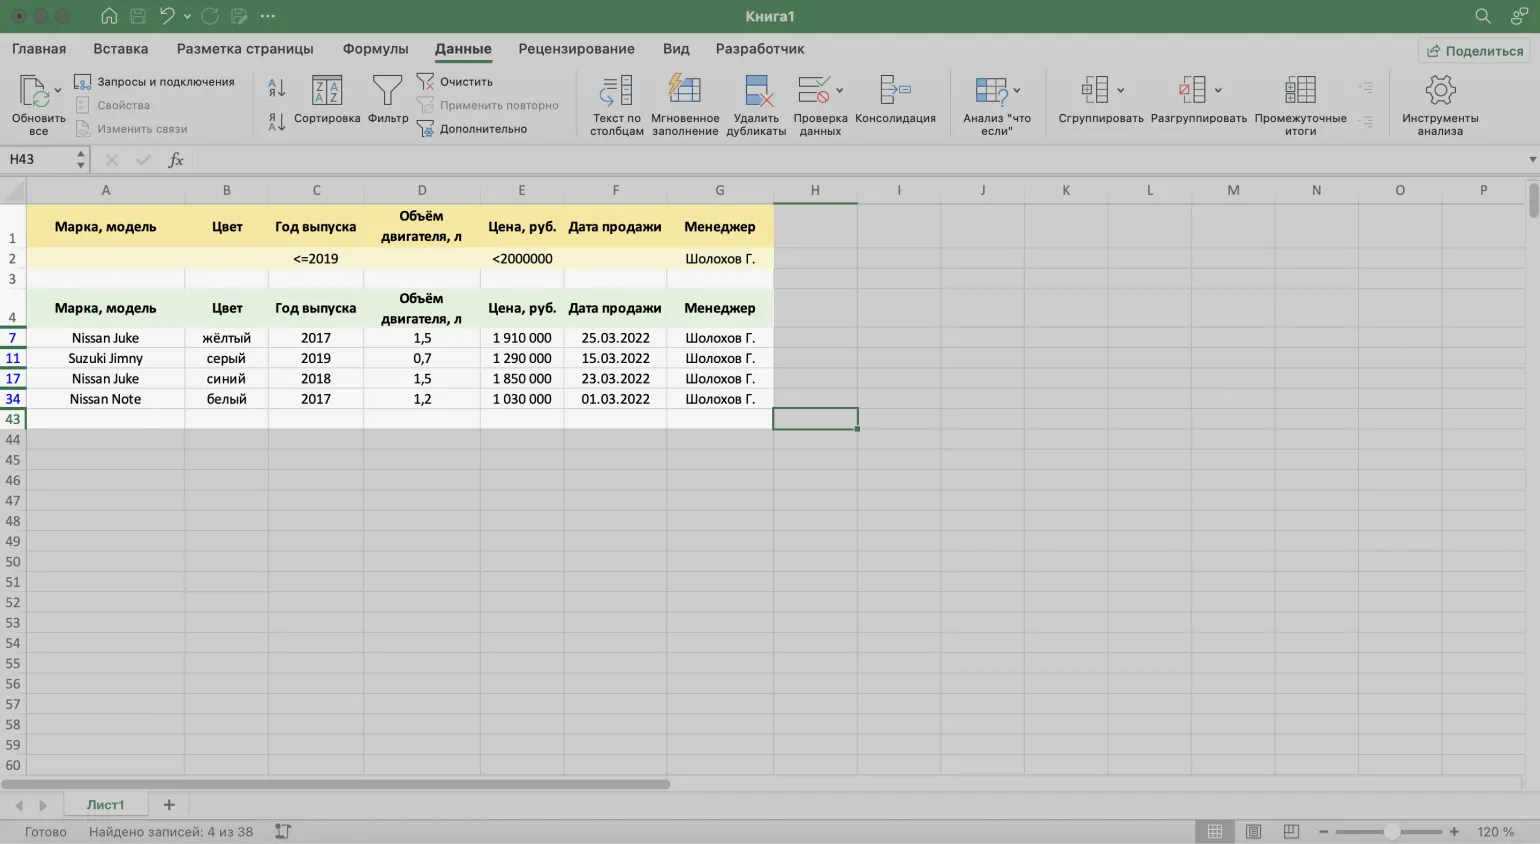
Create a table for filtering conditions by copying the header of the original table and pasting it at the top of the document. This step will help you organize your data and simplify further work with the information. Make sure your headings align with your content to ensure easy filtering and searching.
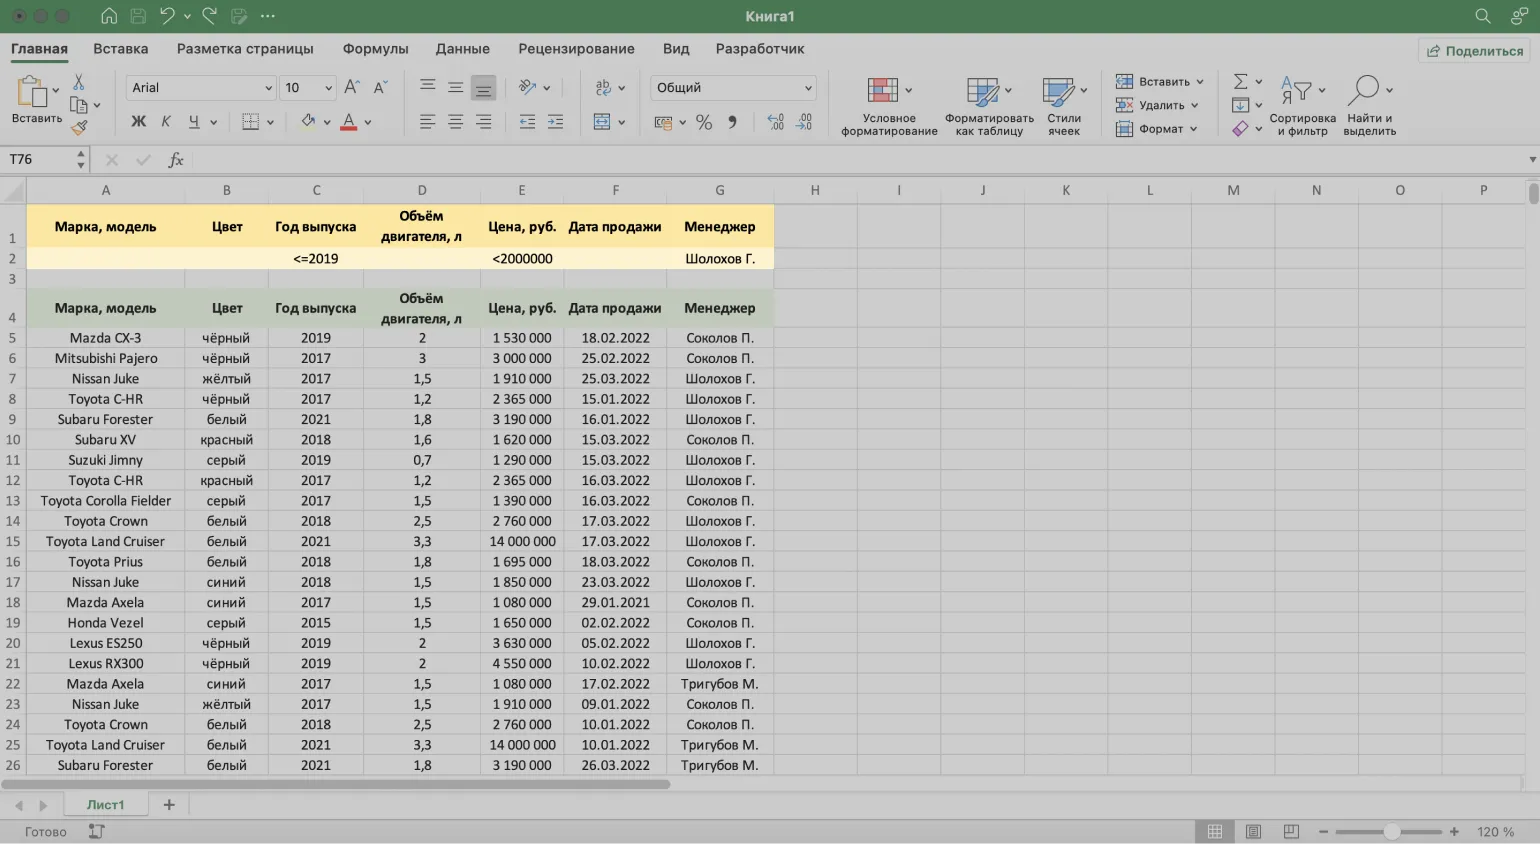
The second step is to enter filtering criteria in the new table. This will allow you to more accurately select the required data and simplify the information analysis process. Make sure all parameters are set correctly to achieve maximum filtering effectiveness. Correctly setting the criteria will significantly improve the quality of the results obtained and simplify further actions with the data.
- Year of release: <=2019.
- Price (RUB): <2,000,000.
- Manager: Sholokhov G.
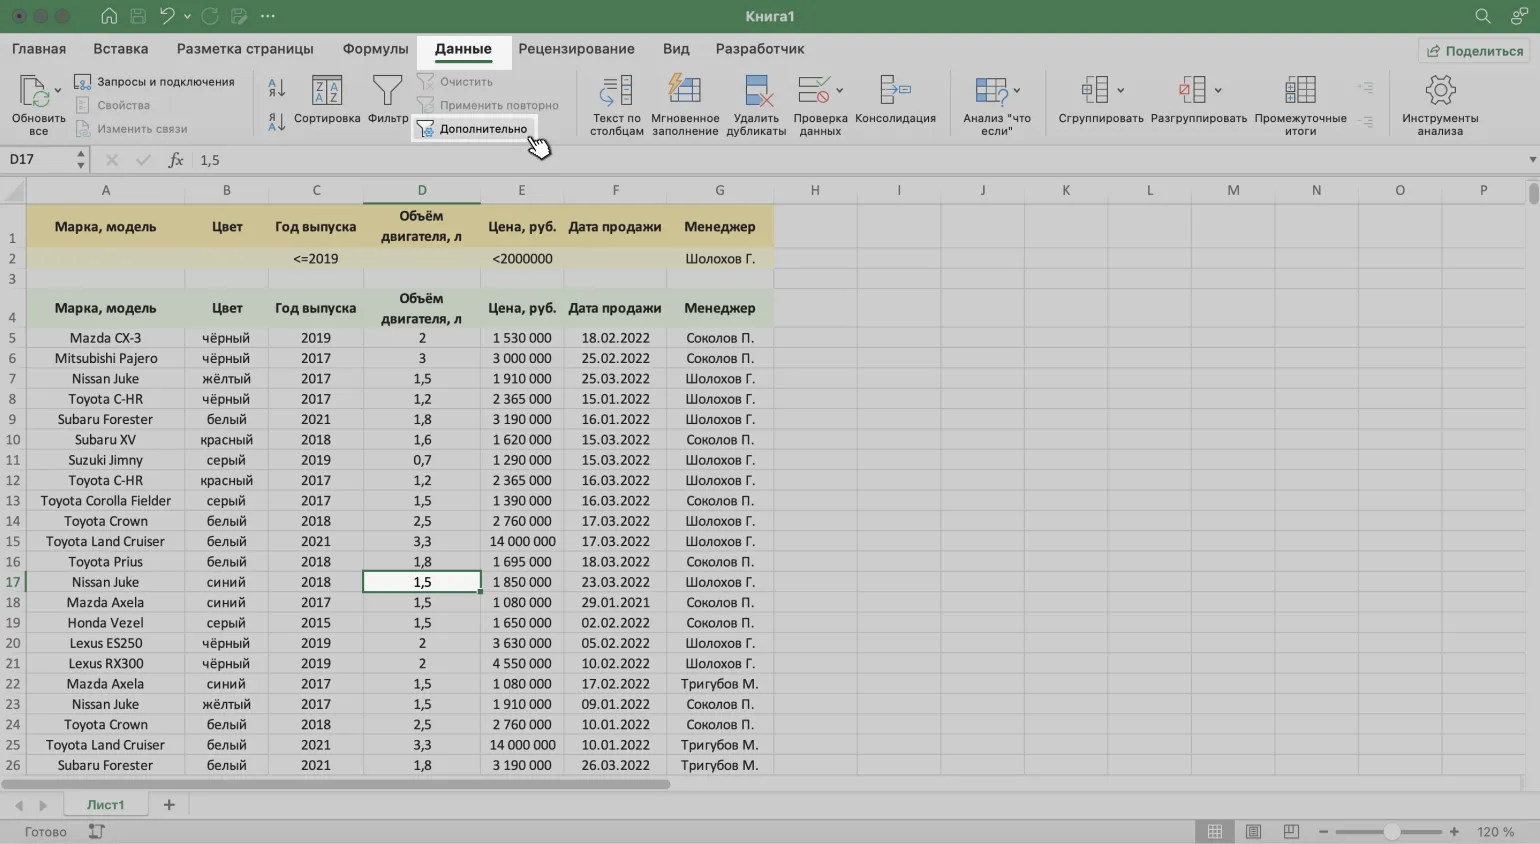
Select any cell in your source table and go to the "Data" tab. After that, click the "Advanced" button to access advanced data processing functions.
In the fourth step, open the window that appears and enter all the necessary filtering parameters. This will allow you to fine-tune the results and get exactly the information you need. Make sure all fields are filled in correctly to optimize the search process.
- Choose where the results will appear: in the source table or elsewhere. For our example, we'll select "Filter list in place."
- List range - automatically populated when you select a cell in the source table before calling the menu.
- Criteria range - specify the table range with criteria. Select the header and the line with the criteria; they will automatically appear in the parameters.

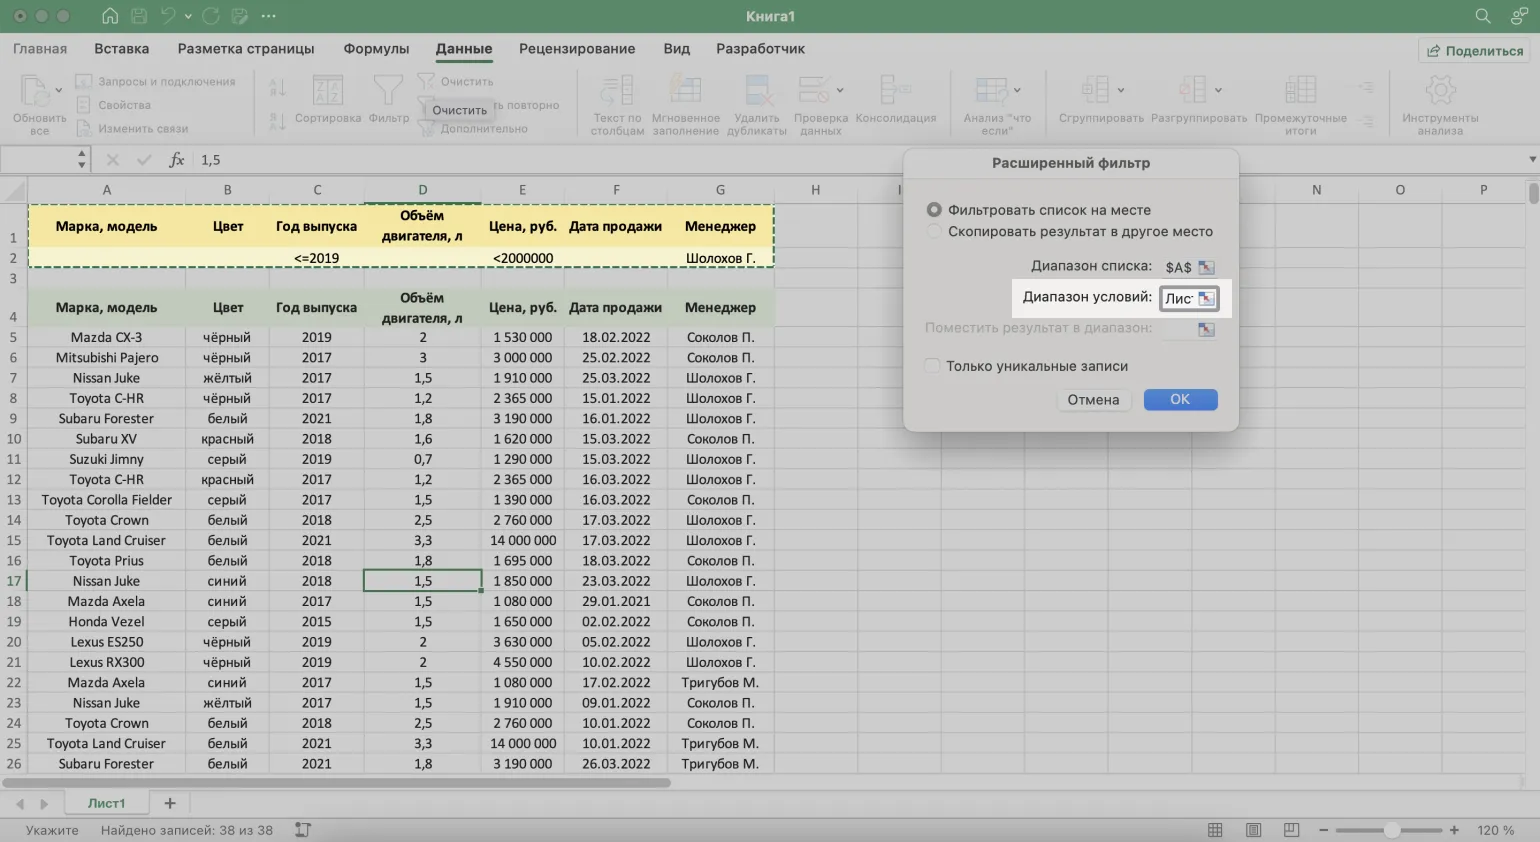
To complete the process, click the "OK" button in the advanced filter menu.
The source table has been successfully filtered according to the set criteria.
How to remove a filter in Excel: simple methods
Data filtering in Excel is an important tool for analyzing large amounts of information. However, in some cases, it is necessary to remove applied filters. In this text, we will consider three effective ways to unfilter data in Excel.
Clearing a filter in a table is done through the column menu. To do this, click the drop-down arrow in the filtered column and select the "Clear Filter" option. This method is the fastest and most convenient way to return the data to its original state.
Using the "Home" tab in your interface. To manage your data, click the "Sort and Filter" button on the toolbar. You can either uncheck the "Filter" option or use the "Clear Filter" function to return the data to its original state.
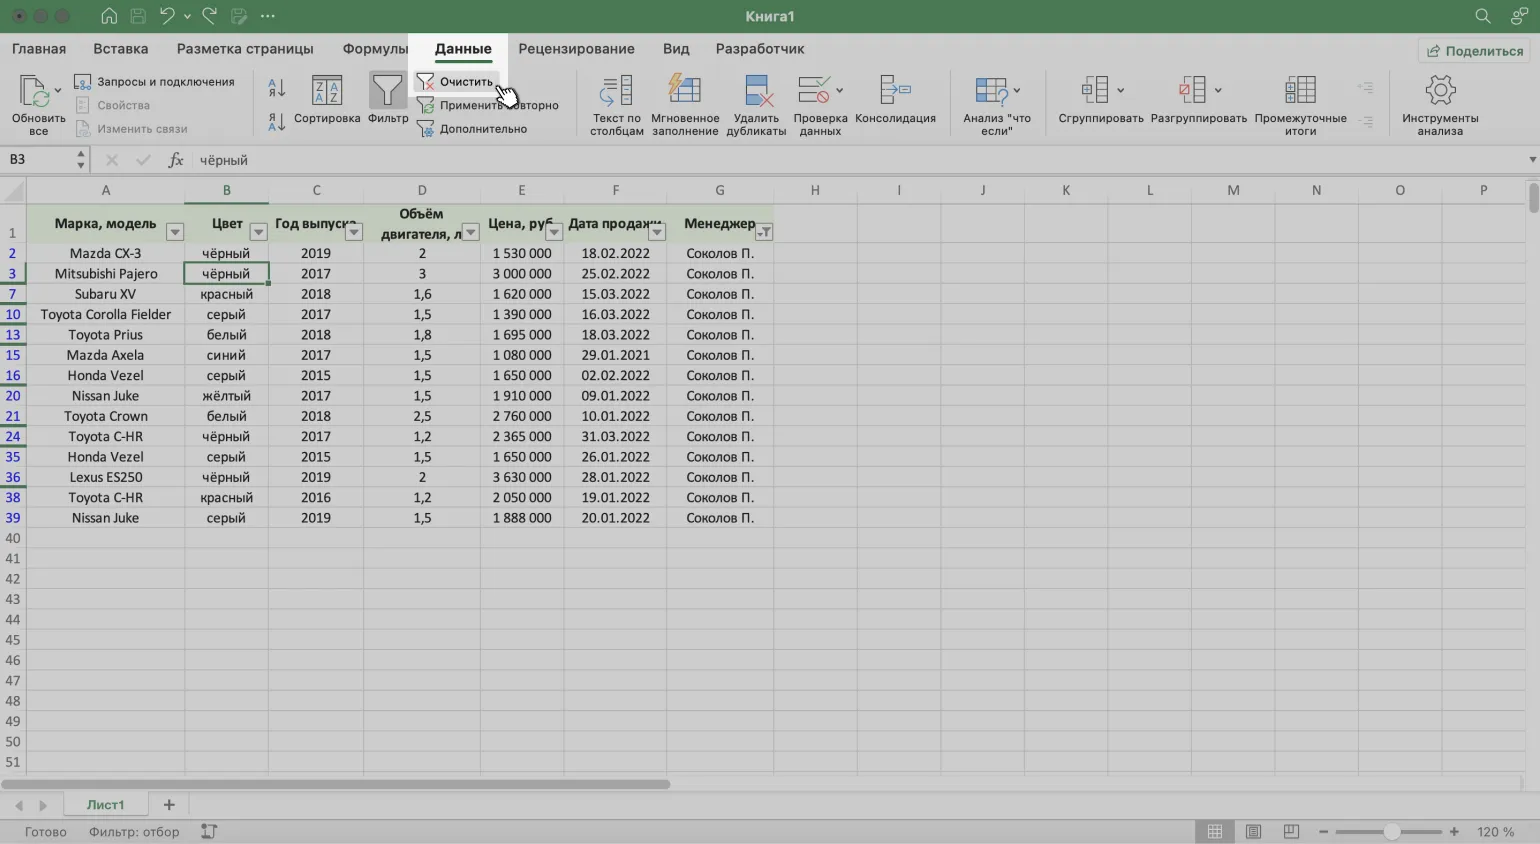
Clearing a filter in Excel is done through the "Data" tab. To do this, open the "Data" tab and click the "Clear" button. This action will remove all applied filters from the current table, allowing you to see all the data without restrictions.
These methods will help you effectively manage data filtering in Excel. Apply the approaches that are most convenient and suitable for your tasks. Proper data filtering will allow you to quickly find the information you need and simplify data analysis.
Additional Excel resources from Skillbox Media offer extensive materials for learning and improving your skills in this program. On our website, you will find courses, webinars, and articles that will help you master various Excel functions, including data analysis, chart creation, and process automation. These resources are suitable for both beginners and professionals looking to deepen their knowledge. Take a look at the practical tasks and examples to help you consolidate your acquired skills. Skillbox Media strives to provide relevant information and useful tools for using Excel effectively in your work.
- How to Merge Cells and Data in Excel: A Complete Guide
- How to Use VLOOKUP in Excel to Move Data Between Tables
- Step-by-Step Instructions for Freezing Rows and Columns in Excel
- Creating Drop-Down Lists in Excel: How to Simplify Data Entry
- How to Create and Customize Charts in Excel: Tips and Tricks
Excel and Google Sheets: 7 Steps to PRO Level
Want to become a master of Excel and Google Sheets? Learn 7 simple steps to automate your work! Read the article.
Find out more